How to show/hide overlay depending on zoom level

Dear holoviews forum,

I would like to realize the following use case with bokeh/holoviews:

I want to make a scatter plot of a two-dimensional data set.
The data set is too large to be sensibly visualized with bokeh (say, some 100k to a million points) - on the other hand, the ability to interact with individual points (e.g. via the hover tool) is very valuable.

In order to get the best of both worlds, I would like to show a full view of the plot in the beginning using holoviews.operation.datashader.datashade, but then add an overlay with the bokeh scatter plot when the user has zoomed in enough to have a manageable number of points in the view.

My question is: How do I achieve this?

What I did so far (just in case this is helpful for the maintainers of the docs):
After looking through the gallery (e.g. Mandelbrot / Nyyaxi hover) and finding what I was looking for, I started reading the holoviews documentation. My first thought was to use the holoviews hooks but it seems those are executed only once (after the initial plot has been rendered).
I then looked through the bokeh documentation and came across the LODEnd / LODStart events - which would seem to be the events I want to attach a callback to.
However, dabbling around with the holoviews plot objects, I didn’t figure out whether/where those events are exposed in holoviews.
I then discovered that holoviews has a different way of customizing interactivity.
I looked through the available streams, which do provide things like PlotSize but I didn’t find an equivalent to LODEnd / LODStart.

So, before heading off into a dead end I thought - better ask :wink:

I’m new to holoviews but have some python experience. I’m happy to put some work into it and prepare an example for the gallery if desired - I think this use case can be interesting to a wider audience.

Best,
Leopold

P.S. Here is some code in case someone wants to quickly dabble around

import holoviews as hv
from holoviews.operation.datashader import datashade
import numpy as np

hv.notebook_extension('bokeh')

np.random.seed(1)
points = hv.Points(np.random.multivariate_normal((0,0), [[0.1, 0.1], [0.1, 1.0]], (5000,)),label="Points")

dynamic_hover = (datashade(points, width=400, height=400) * points)
dynamic_hover.opts(hv.opts.Points(tools=['hover'], alpha=0.0, hover_alpha=0.2))

You can build this pretty easily by using a RangeXY stream. A basic example would look something like this:

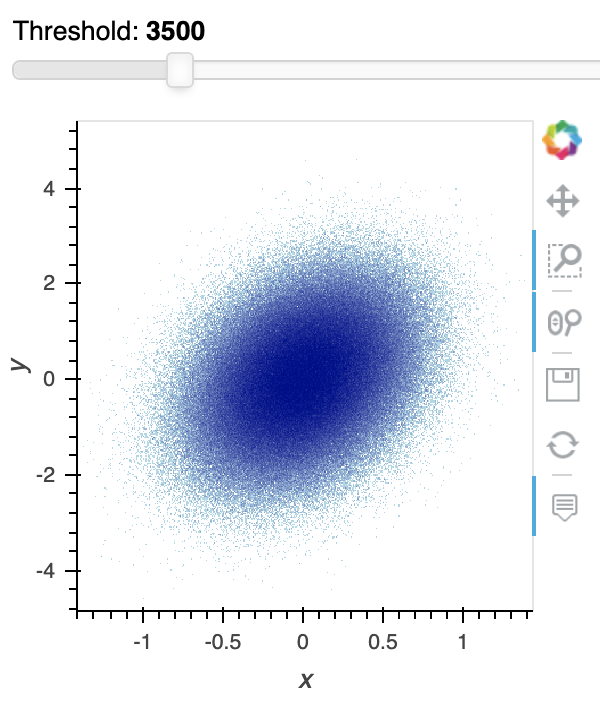
points = hv.Points(np.random.multivariate_normal((0,0), [[0.1, 0.1], [0.1, 1.0]], (500000,)))


def filter_points(points, x_range, y_range):
    if x_range is None or y_range is None:
        return points
    return points[x_range, y_range]

def hover_points(points, threshold=5000):
    if len(points) > threshold:
        return points.iloc[:0]
    return points

range_stream = hv.streams.RangeXY(source=points)
streams=[range_stream]

filtered = points.apply(filter_points, streams=streams)
shaded = datashade(filtered, width=400, height=400, streams=streams)
hover = filtered.apply(hover_points)

dynamic_hover = (shaded * hover).opts(
    hv.opts.Points(tools=['hover'], alpha=0.1, hover_alpha=0.2, size=10))

zoom_hover

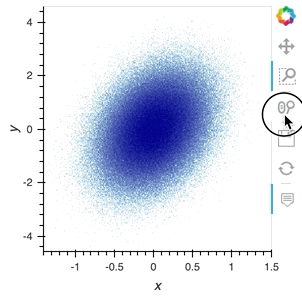
Here we built a little pipeline starting with the set of points, apply the filter_points function which selects only the points in the current view port by taking the x_range and y_range from the RangeXY stream and then finally datashade the result and apply the hover_points function which returns an empty set of points if there are more points than the defined threshold. You can even add a panel widget to control the threshold:

range_stream = hv.streams.RangeXY(source=points)
streams=[range_stream]

threshold = pn.widgets.IntSlider(name='Threshold', start=1000, end=10000, step=100)
filtered = points.apply(filter_points, streams=streams)
hover = filtered.apply(hover_points, threshold=threshold)
shaded = datashade(filtered, width=400, height=400, streams=streams)

dynamic_hover = (shaded * hover).opts(
    hv.opts.Points(tools=['hover'], alpha=0.1, hover_alpha=0.2, size=10))

pn.Column(threshold, dynamic_hover)

5 Likes

Thank you so much @philippjfr - this is fantastic!

As I mentioned, I believe some form of this would be a great addition to the gallery.
Happy to make a PR for this.

2 Likes

That would be fabulous!

Hello,
I tried to do this for combining panel and hvplot (together with datashader).

if it is inspiring…

1 Like

Hi @slamer59.

Looks awesome. Maybe it was worth promoting in the new showcase category?

A little background, images, link and video would make a great showcase.

Hello @Marc, I just saw your work on awesome awesome-panel !

And I have the same feeling that it can be a good idea. And there will be bigger audience. :slight_smile:
Maybe in awesome if you like too.

The thing I don’t like, in this work I have done, is the reloading of the graphs.

I will also check if there is an improvement after your work here:

1 Like