How to preserve lat/lon coordinate labels when projecting data?

Hi Holoviz discourse,

Outside of the PlateCarree cartopy projection, when I set a projection on an hvplot and/or a geoviews feature, like coastline or states, the latitude and longitude values on the axes of the plot disappear. This makes it hard for the viewer to see exactly what lat/lon values are, particularly important for regional, non global plots. Can anyone here on the Holoviz discourse offer some advice for addressing this? Is this because the precise lat/lon values are no longer known now that the data has been re-projected?

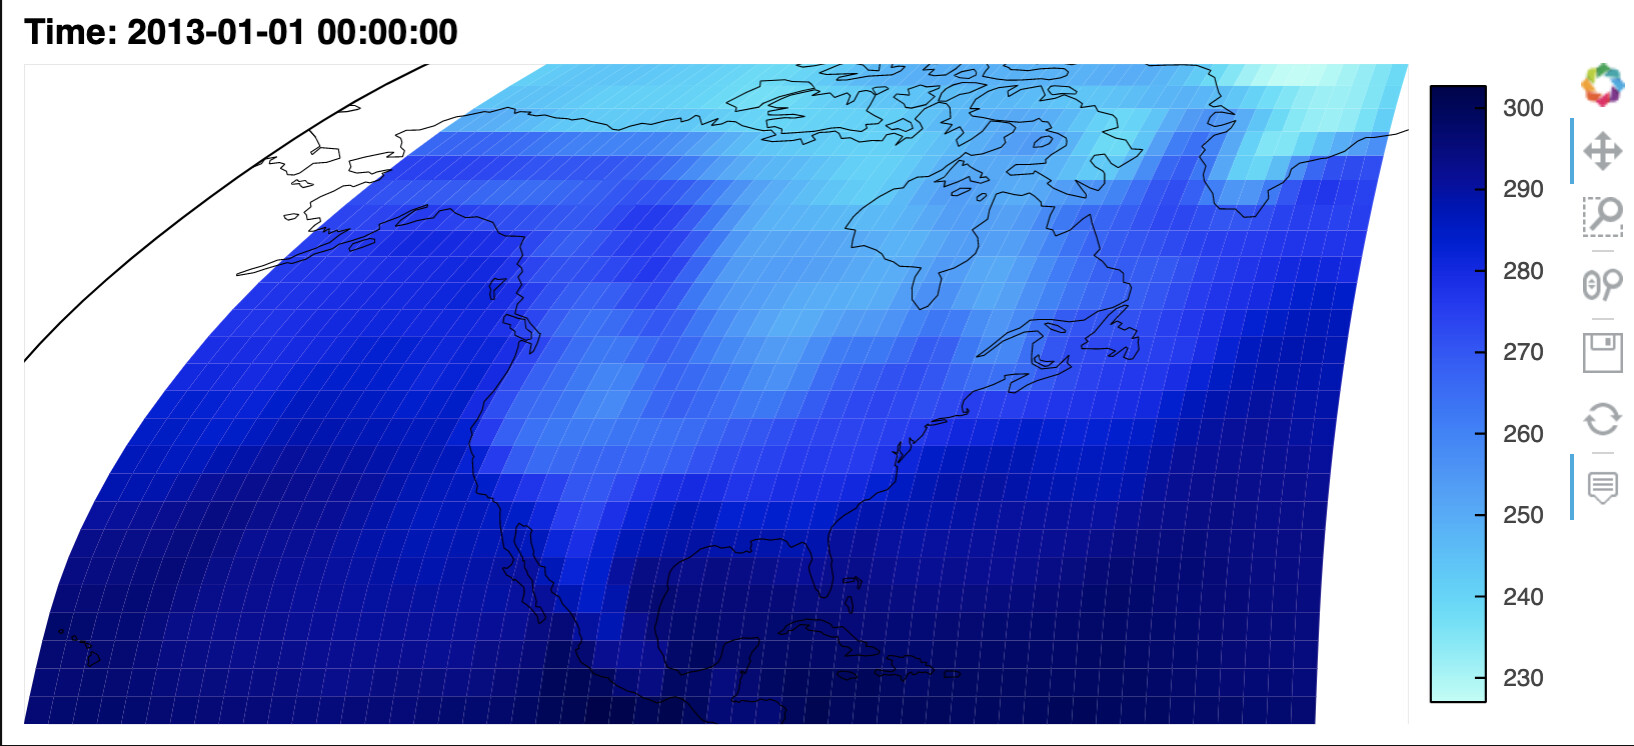
Below is a reproducible example. Switch which projection lines are commented to see the difference with lat/lon coordinate labels on the axes. Photo shows Robinson projection without any labels.

import hvplot.xarray 
import xarray as xr
import geoviews as gv

xr.tutorial.open_dataset('air_temperature').air.hvplot.quadmesh(x='lon', y='lat', 
#          projection=ccrs.Robinson()
            projection=ccrs.PlateCarree()
             ) *\
gv.feature.coastline().opts(
#     projection=ccrs.Robinson(),
    projection=ccrs.PlateCarree(),
    fill_alpha=0)

Thank you, appreciate any help.

The way I would approach is to apply a custom HoverTool to transform it from the projection coordinates into lat/lon. Here is an example for ccrs.GOOGLE_MERCATOR (the default CRS), but for the ccrs.Robinsion another calculation is properly needed.

import cartopy.crs as ccrs
import xarray as xr
from bokeh.models import CustomJSHover, HoverTool

import geoviews as gv
import hvplot.xarray

gv.extension("bokeh")

ds = xr.tutorial.open_dataset("air_temperature")

# Setting up custom formatter
formatter_code = """
const projections = Bokeh.require("core/util/projections");
const x = special_vars.x
const y = special_vars.y
const coords = projections.wgs84_mercator.invert(x, y)
return "" + (coords[%d]).toFixed(4)
"""

formatter_code_x = formatter_code % 0
formatter_code_y = formatter_code % 1

custom_tooltips = [
    ("lon", "@lon{custom}"),
    ("lat", "@lat{custom}"),
]
custom_formatters = {
    "@lon": CustomJSHover(code=formatter_code_x),
    "@lat": CustomJSHover(code=formatter_code_y),
}
custom_hover = HoverTool(tooltips=custom_tooltips, formatters=custom_formatters)

ds.air.hvplot.quadmesh(x="lon", y="lat", features=["coastline"], tools=[custom_hover])