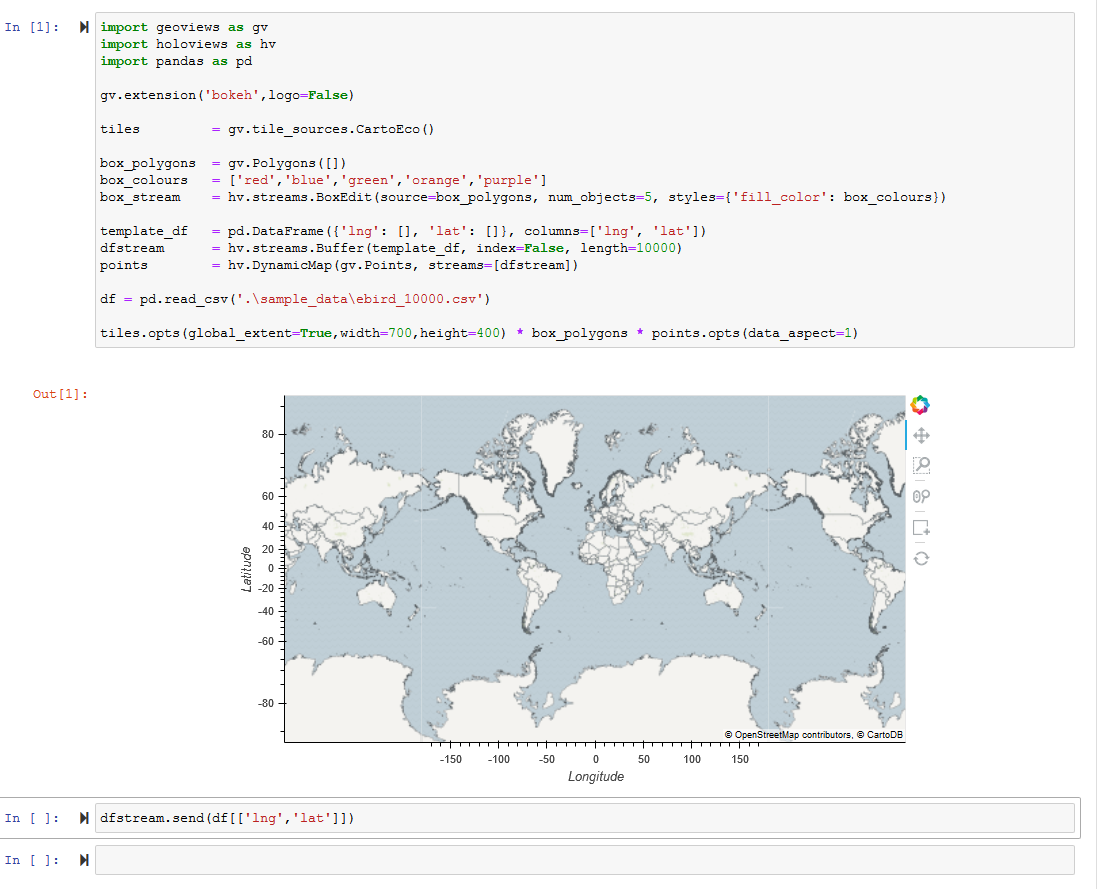
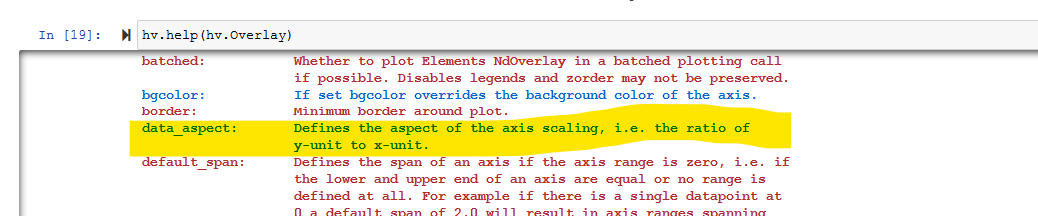
In this version I attempt to use .options(xlim,ylim) on the overlay to set the map extent e, which is a param.Parameter() after the ‘Run’ button is pressed.
This version doesn’t exactly work but I don’t know why. The properties of the map are set correctly but only work on a new instance of the map inline in the Jupyter Notebook. In the dashboard it results in the map being reprojected and the drawn boxes vanishing. I’m stumped as to why the hv.streams.BoxEdit data is removed from the map.
You will see that my code to set the extents of the map has works correctly, but is not reflected in the dashboard for some reason. It is only reflected in a new instance of the map. And while the map in the dashboard is skewed (reprojected?) the new inline map in the notebook is not.
import panel as pn
import param
import geoviews as gv
import holoviews as hv
import pandas as pd
import geopandas as gpd
from cartopy import crs
from datashader.utils import lnglat_to_meters
from shapely.geometry import Point, box
gv.extension('bokeh',logo=False)
pn.extension()
class Inputs(param.Parameterized):
input_file = param.FileSelector(path='.\jupyter-geo-box-query\sample_data\*.csv', doc='A .csv file selector for input data')
x_field = param.Selector(doc='A field selector for longitude')
y_field = param.Selector(doc='A field selector for latitude')
id_field = param.Selector(doc='A field selector for the identifier')
data = None
@param.depends('input_file', watch=True)
def update_inputs(self):
df = pd.read_csv(self.input_file)
numeric_cols = list(df.select_dtypes(include=['float64']).columns)
columns = [x for i,x in enumerate(df.columns) if x !='Unnamed: 0']
self.param.x_field.objects = numeric_cols
self.x_field = numeric_cols[0]
self.param.y_field.objects = numeric_cols
self.x_field = numeric_cols[0]
self.param.id_field.objects = columns
self.id_field = columns[0]
self.data = df
class Mapview(param.Parameterized):
opts = dict(width=1200,height=750,xaxis=None,yaxis=None,show_grid=False)
tiles = gv.tile_sources.CartoEco().apply.opts(**opts)
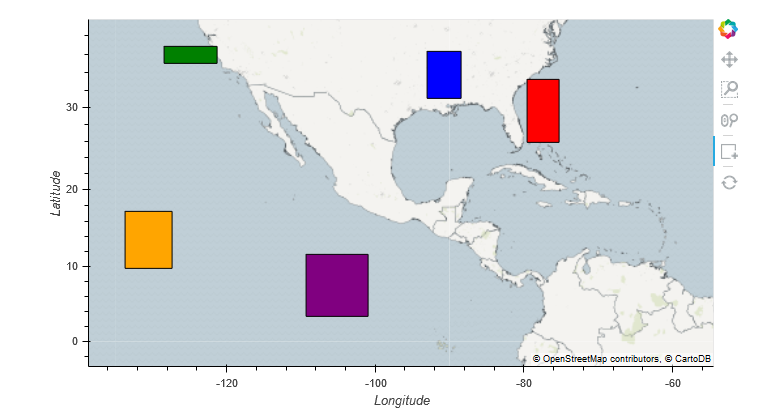
box_polygons = gv.Polygons([]).opts(fill_alpha=0.1)
box_colours = ['red','blue','green','orange','purple']
box_stream = hv.streams.BoxEdit(source=box_polygons, num_objects=5, styles={'fill_color': box_colours})
template_df = pd.DataFrame({'x_meters': [], 'y_meters': []}, columns=['x_meters', 'y_meters'])
dfstream = hv.streams.Buffer(template_df, index=False, length=10000)
points = hv.DynamicMap(hv.Points, streams=[dfstream]).opts(
size=5, color='green', fill_alpha=0.3, line_alpha=0.4)
e = param.Parameter(default=[None,None,None,None],precedence=-1)
@param.depends('e',watch=True)
def show_map(self):
print('show_map() has been called.')
try:
if self.e[0] is None:
print('Using global extent')
return (self.tiles * self.box_polygons * self.points).options(xlim=(-20000000,20000000),ylim=(-6000000,6000000))
else:
print(f'Using new extents: {self.e[0]},{self.e[2]},{self.e[1]},{self.e[3]}')
return (self.tiles * self.box_polygons * self.points).options(xlim=(self.e[0],self.e[2]),ylim=(self.e[1],self.e[3]))
except:
print('Problem in show_map()')
class Dashboard(param.Parameterized):
input1 = Inputs()
input2 = Inputs()
input3 = Inputs()
input4 = Inputs()
input5 = Inputs()
mapview = Mapview()
button = param.Action(lambda x: x.param.trigger('button'), label='Run')
def project_to_meters(self, df, x, y):
try:
df.loc[:,'x_meters'], df.loc[:,'y_meters'] = lnglat_to_meters(df[x],df[y])
geometry = [Point(xy) for xy in zip(df.x_meters, df.y_meters)]
web_merc = {'init': 'epsg:3857'}
return gpd.GeoDataFrame(df, crs=web_merc, geometry=geometry)
except:
print("""Could not project specified coordinate fields to meters. Make sure the X Field and Y Field
values have been set correctly.\n""")
def convert_box_stream_data_to_geometry(self):
try:
box_data = self.mapview.box_stream.data
try:
num_boxes = len(box_data['x0'])
except:
num_boxes = 0
boxes = []
for i in range(0,num_boxes):
x0 = box_data['x0'][i]
y0 = box_data['y0'][i]
x1 = box_data['x1'][i]
y1 = box_data['y1'][i]
boxes.append(box(x0,y0,x1,y1))
if len(boxes)>0:
return boxes
except:
print('Could not convert boxes drawn on map into geometries.\n')
@param.depends('button')
def run_analysis(self):
try:
# clear previous results
self.mapview.dfstream.clear()
# Convert each input into a GeoDataFrame and project coordinates to meters
datasets = []
id_fields = []
for i in [self.input1, self.input2, self.input3, self.input4, self.input5]:
if isinstance(i.data, pd.core.frame.DataFrame):
gdf = self.project_to_meters(i.data, i.x_field, i.y_field)
datasets.append(gdf)
id_fields.append(i.id_field)
# Convert boxes drawn on the map into Shapely geometries
if len(datasets)>0:
boxes = []
box_data = self.mapview.box_stream.data
for i in range(0,len(box_data['x0'])):
x0 = box_data['x0'][i]
y0 = box_data['y0'][i]
x1 = box_data['x1'][i]
y1 = box_data['y1'][i]
boxes.append(box(x0,y0,x1,y1))
# Do intersections of each box on each GeoDataFrame & send results to the map
df_all_boxes = pd.DataFrame()
df_final = pd.DataFrame()
box_labels = []
for i in range(0,len(datasets)):
for b in boxes:
box_label = self.mapview.box_colours[boxes.index(b)] + '_box'
box_labels.append(box_label)
datasets[i][box_label] = datasets[i].intersects(b)
selected = datasets[i].loc[datasets[i][box_label]==True].drop(columns='geometry')
self.mapview.dfstream.send(pd.DataFrame(selected[['x_meters','y_meters']]))
selected.rename(columns={id_fields[i]:'identifier'},inplace=True)
df_all_boxes = pd.concat([df_all_boxes,selected[['identifier',box_label]]],axis=0,ignore_index=True)
for ident in pd.unique(df_all_boxes['identifier']):
dfx = df_all_boxes.loc[df_all_boxes['identifier']==ident]
box_values = {'identifier':[ident]}
for bl in box_labels:
# returns true if any of the values are true
# else returns false
box_values[bl] = [dfx[bl].any()]
df_ident = pd.DataFrame.from_dict(box_values)
df_final = pd.concat([df_final, df_ident],axis=0)
def summarize_boxes(row):
cols = list(row.axes[0])
s = []
for c in cols:
if 'box' in c:
if row.values[cols.index(c)]:
s.append(c.split('_')[0])
return ','.join(s)
summary = df_final.copy()
try:
# build an extent to zoom to based on the current drawn boxes
boxes = self.mapview.box_stream.data
xmin = min(boxes['x0'])
xmax = max(boxes['x1'])
ymin = min(boxes['y0'])
ymax = max(boxes['y1'])
new_extent = box(xmin,ymin,xmax,ymax)
self.mapview.e = new_extent.bounds
except:
print('Problem calculating new map extent.')
try:
summary['Found_In'] = summary.apply(lambda row: summarize_boxes(row),axis=1)
return pn.widgets.DataFrame(summary, disabled=True, fit_columns=True, width=700)
except:
print('There was an error creating the final output summary table.\n')
else:
print('You must select at least one input dataset.\n')
except:
print('Something went wrong in the run_analysis() function.\n')
return('Something went wrong in the run_analysis() function.')
def view(self):
desc = """This is a demonstration dashboard with incomplete functionality. Its purpose
is to sit here and look pretty. We can put graphics and stuff in here to
make it look all fancy."""
logo = '.\images\logo_panel_stacked_s.png'
button_desc = """The <i>Run</i> button will execute the spatial intersection and generate
a table of identifiers found within each box and in multiple boxes.<br><br>
Push the <i>Run</i> button after configuring all inputs and drawing boxes on the map."""
return pn.Row(
pn.Column(
'## Description',
desc,logo),
pn.Column(
'### Configure Inputs',
pn.Tabs(
('Input 1',self.input1),
('Input 2',self.input2),
('Input 3',self.input3),
('Input 4',self.input4),
('Input 5',self.input5)),
button_desc,
self.param['button']),
pn.Tabs(
('Map View', pn.Column(self.mapview.show_map())),
('Results Table', self.run_analysis)))
d = Dashboard()
d.view().show()
After you run this notebook, select a file and fields and draw boxes in the dashboard and hit ‘Run’. Look at the map. Then switch to the notebook and run this in a new cell at the bottom:
d.mapview.show_map()
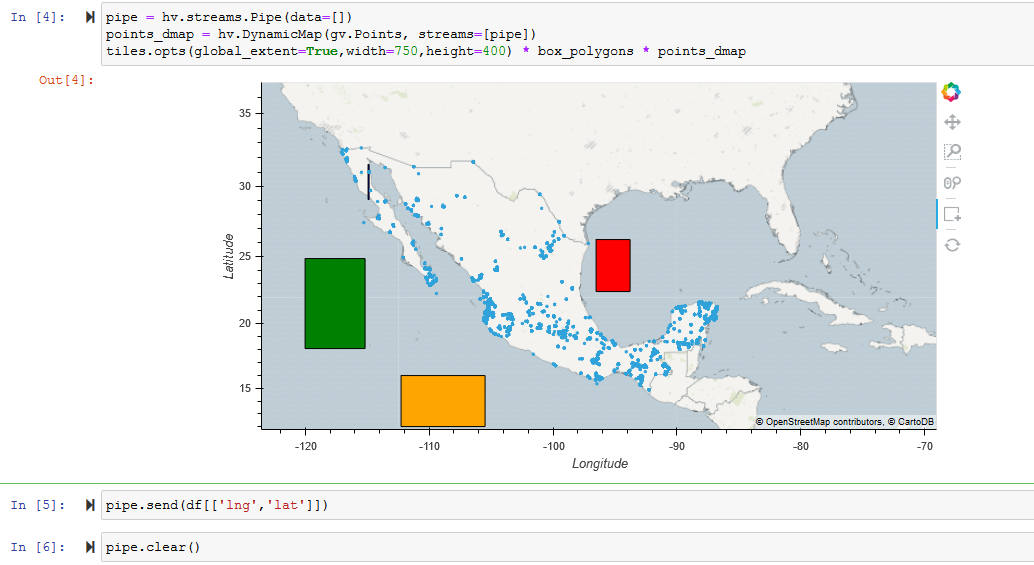
Result in dashboard:
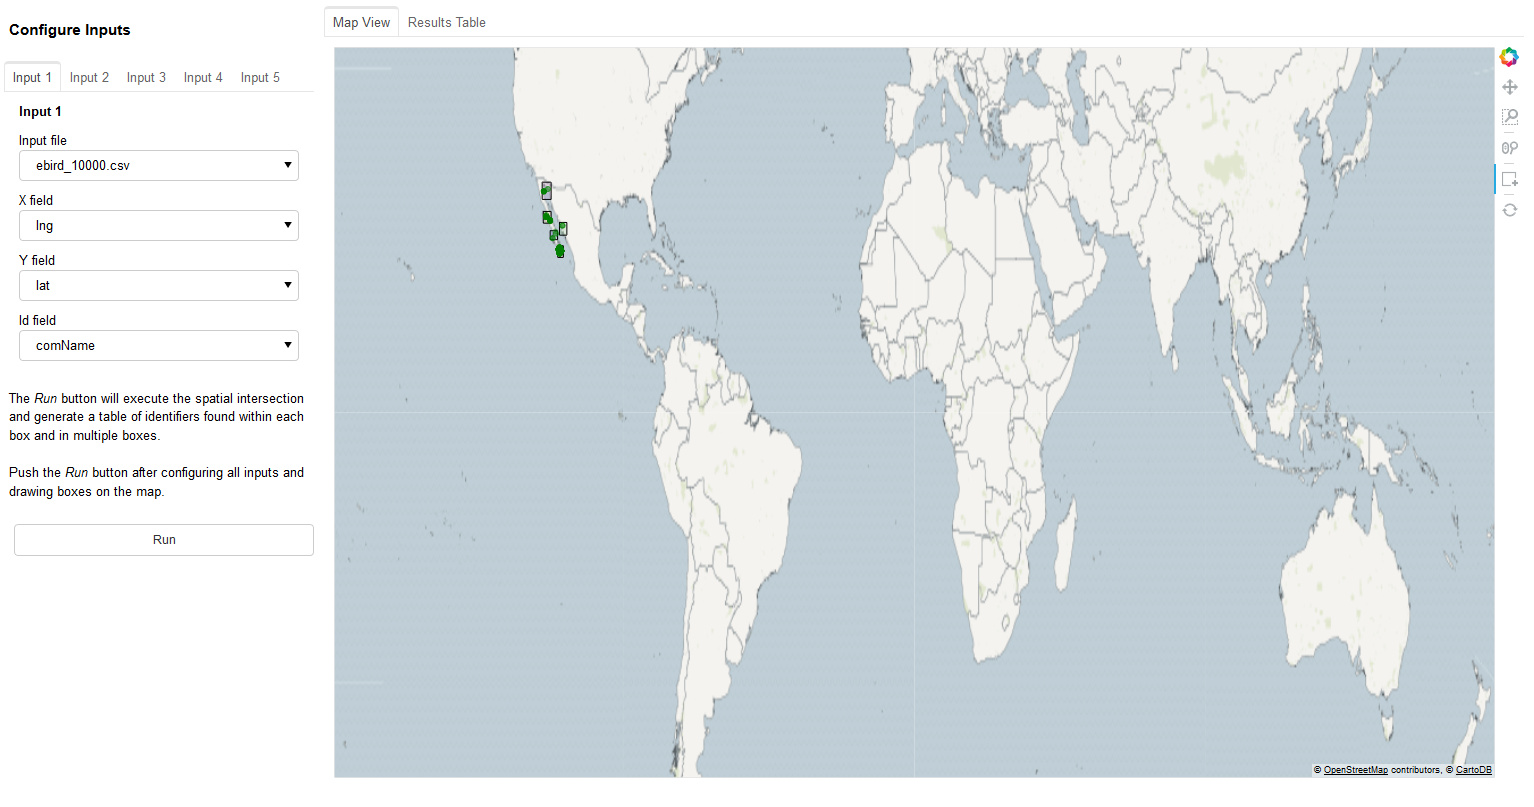
You can see that:
- the map extents were reset to the initial extent
- the map has been skewed (projection has changed?)
- the green dots are there
- the drawn boxes are there
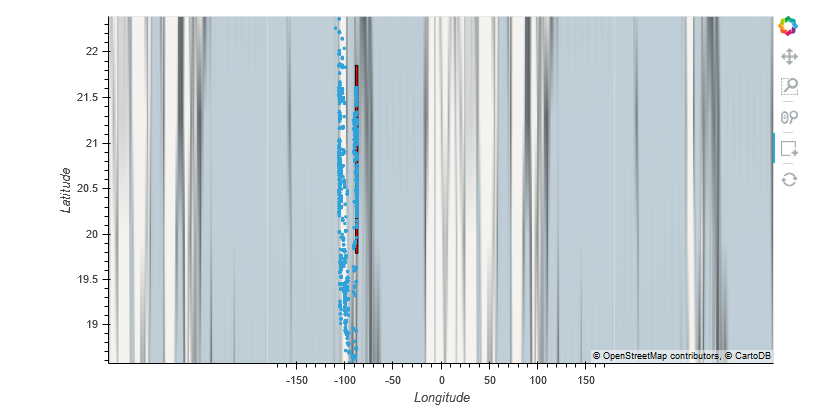
Result in new inline map in the notebook:
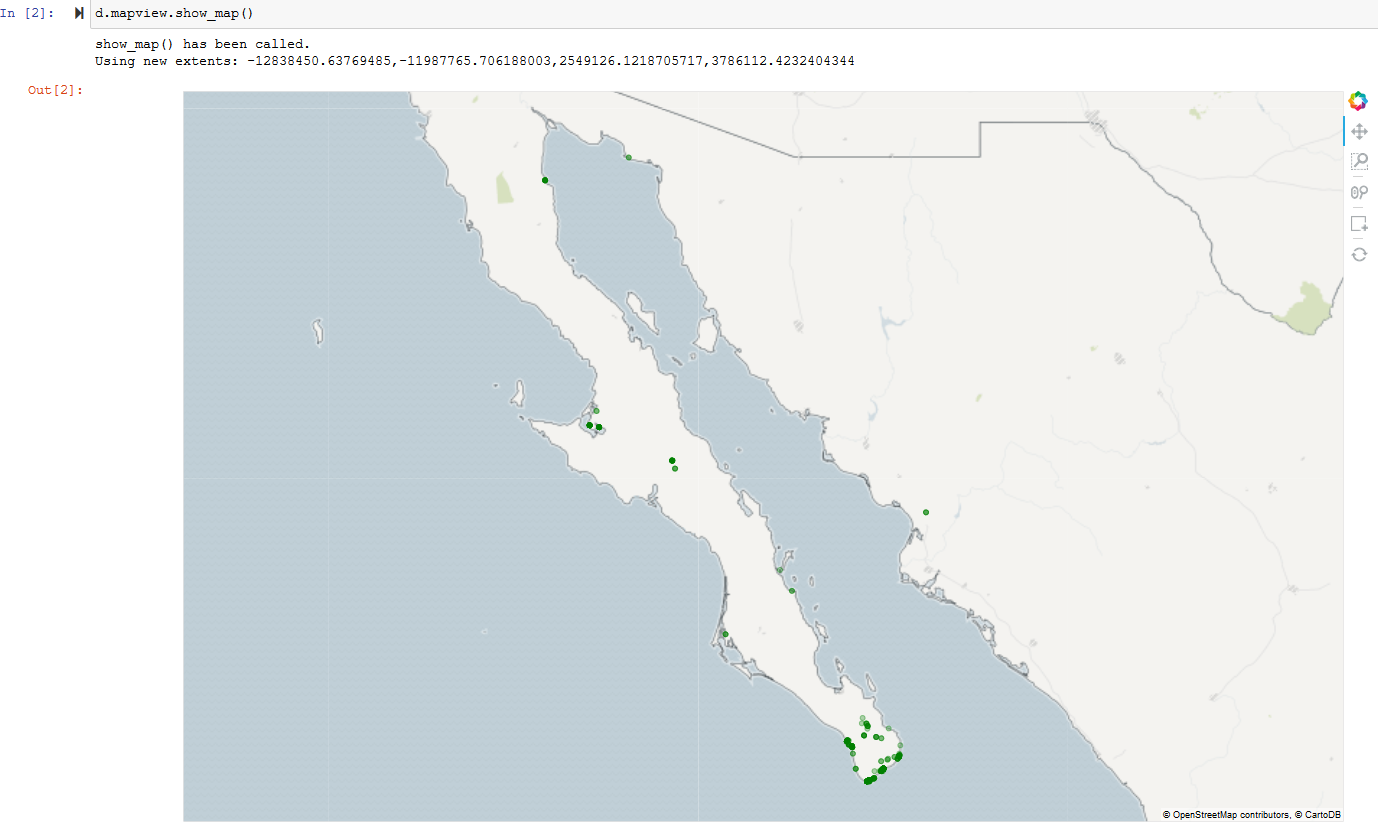
You can see that:
- the map extents were set correctly to match the extents of the drawn boxes
- the map has not been skewed or reprojected
- the green dots are there
- the drawn boxes are not there
I’m confused by the differing properties of these two maps and don’t understand why they are different because they are produced by the same code.
 Nope, not fixed. That only works in my simpler example notebook. When I set