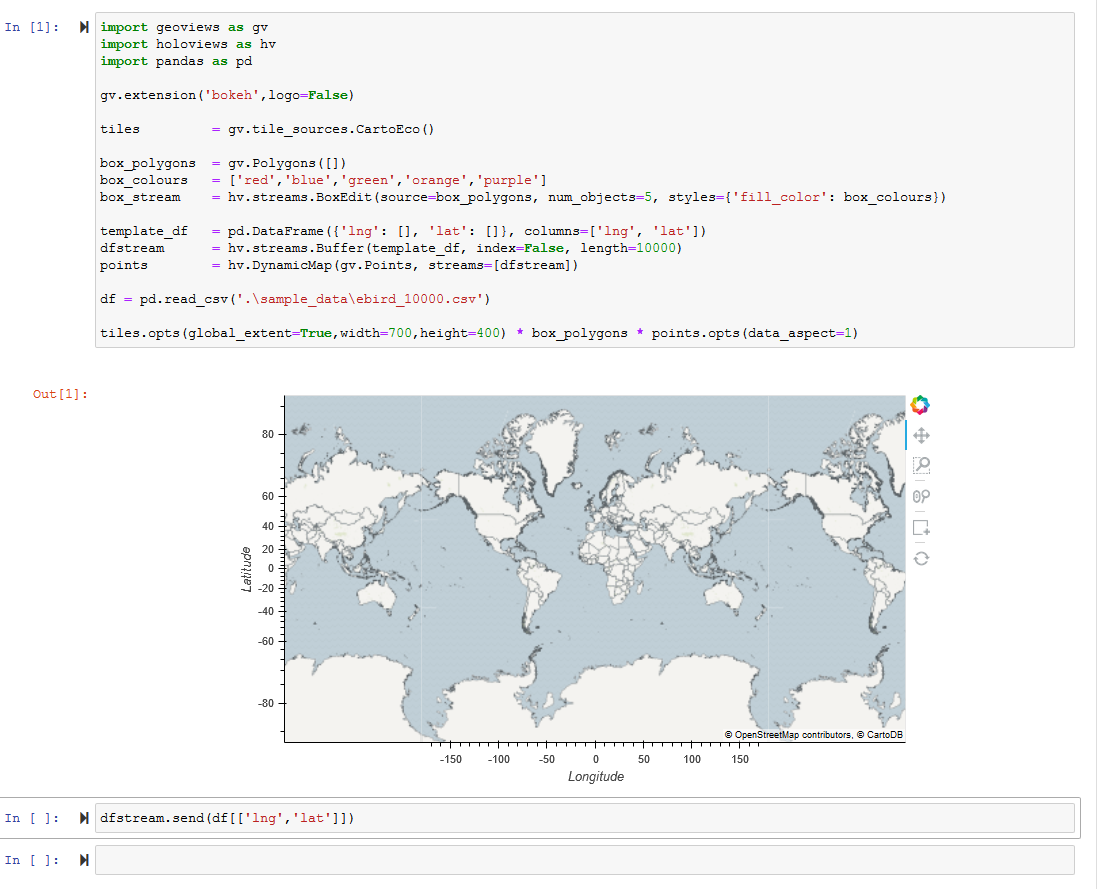
Ok, here’s a simpler example and a simpler question to try to get some clarity on this. @Marc @philippjfr I would very much appreciate your thoughts. I’ve stripped this down to a much simpler example without Panel or Param or any of my classes. Running the first cell gives me this map plot.
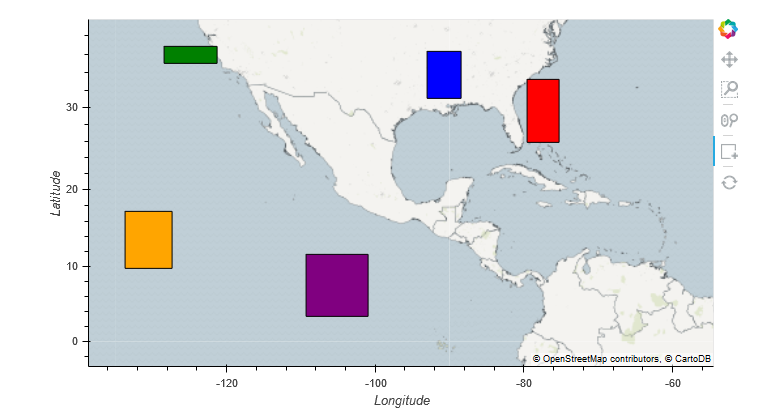
Then I can zoom the map & draw boxes using BoxEdit.
So far, so good. But when I run the last cell to send data to the map via hv.streams.Buffer() the map extents reset and the boxes I drew disappear.
dfstream.send(df[['lng','lat']])
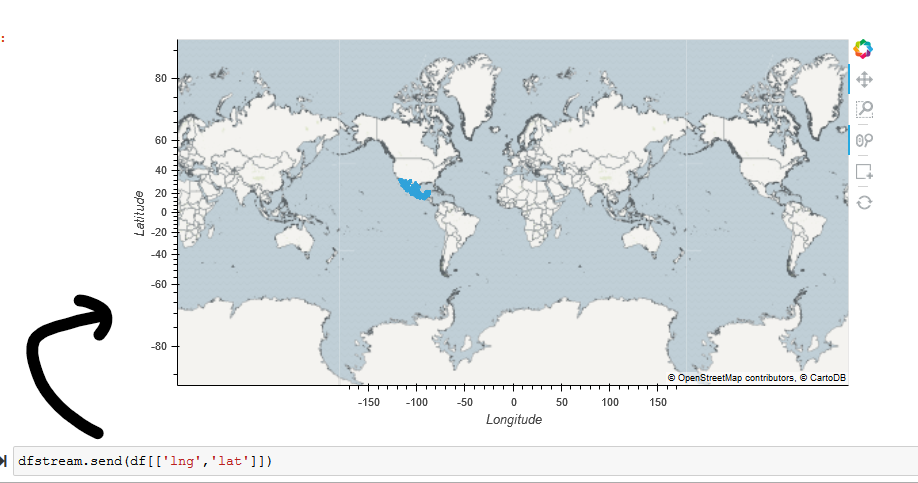
I want to prevent the map from resetting and I want to prevent the boxes from disappearing. Can I do this?
The code and sample file for the points are here.
ebird_10000.csv (1.5 MB)
Map Reset Issue.ipynb (1.6 KB)
import geoviews as gv
import holoviews as hv
import pandas as pd

gv.extension('bokeh',logo=False)

tiles         = gv.tile_sources.CartoEco()

box_polygons  = gv.Polygons([])
box_colours   = ['red','blue','green','orange','purple']
box_stream    = hv.streams.BoxEdit(source=box_polygons, num_objects=5, styles={'fill_color': box_colours})

template_df   = pd.DataFrame({'lng': [], 'lat': []}, columns=['lng', 'lat'])
dfstream      = hv.streams.Buffer(template_df, index=False, length=10000)
points        = hv.DynamicMap(gv.Points, streams=[dfstream])

df = pd.read_csv('.\sample_data\ebird_10000.csv')

tiles.opts(global_extent=True,width=750,height=400) * box_polygons * points.opts(data_aspect=1)
And the last cell:
dfstream.send(df[['lng','lat']])