What is the easiest way to link a scatter plot and a bar chart?
Linked brushing does not support bar charts (Linked Brushing — HoloViews v1.17.1) but https://awesome-panel.org/kickstarter_dashboard shows that it is still possible to link a scatter plot and a bar chart (i.e. when we zoom into the scatter plot, the bar plot is filtered) but the code is far from a minimum working example and – since it is dated 2019 – I’m wondering if there are newer, more straightforward approaches?
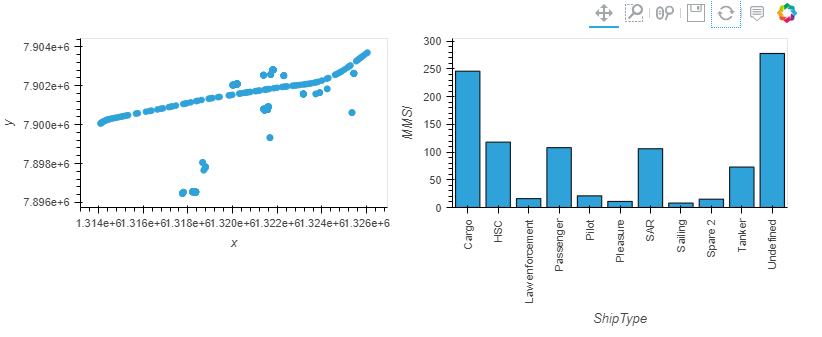
Here’s the minimum example of scatterplot + bar, I’d like to start with: https://github.com/movingpandas/movingpandas-examples/blob/main/3-tech-demos/linked-brushing.ipynb (cell no. 7):