I have a CSV file that contains ticker data for some stock symbols.
I have been successful in using Panel/HVPLOT to plot a single symbol:
import pandas as pd
import hvplot.pandas
import panel as pn


csv_file = "https://raw.githubusercontent.com/metaperl/pure-python-web-development/main/examples/covid-ticker-data/data/ticker-data.csv"
ticker_df = pd.read_csv(csv_file, parse_dates=["Date"], index_col="Date")

import hvplot.pandas
pton_df = ticker_df[ticker_df['Ticker'] == 'PTON']
pton_df.hvplot.line(x='Date', y='Close')
However, my desire is to have a pulldown of all tickers in the dataframe in a MultiSelect and based on which subset of tickers is chosen, render all such tickers with a legend.
the code to get all the tickers is simple:
all_tickers = ticker_df.Ticker.unique().tolist()
but I do not know how to tie the output of the MultiSelect to a function that accepts a list of symbols and plots those symbols on a line chart (ideally with a legend).
I’ve been doing a little more digging. It turns out that all the columns of a dataframe can be printed just by calling plot. So this problem can become as simple as:
- each time the MultiSelect changes the selected values, collect those values (stock symbols) into a list
- create a dataframe with the date as index and the related stock symbol values as columns
- call
.plot() on that dataframe.
But one thing i notice that the MultiSelect docs dont discuss any sort of callback hooks like on_change.
I can suggest you to use the interactive API for this kind of application.
import pandas as pd
import hvplot.pandas
import panel as pn
csv_file = "https://raw.githubusercontent.com/metaperl/pure-python-web-development/main/examples/covid-ticker-data/data/ticker-data.csv"
ticker_df = pd.read_csv(csv_file, parse_dates=["Date"], index_col="Date")
all_tickers = ticker_df.Ticker.unique().tolist()
# Create a MultiSelect widget
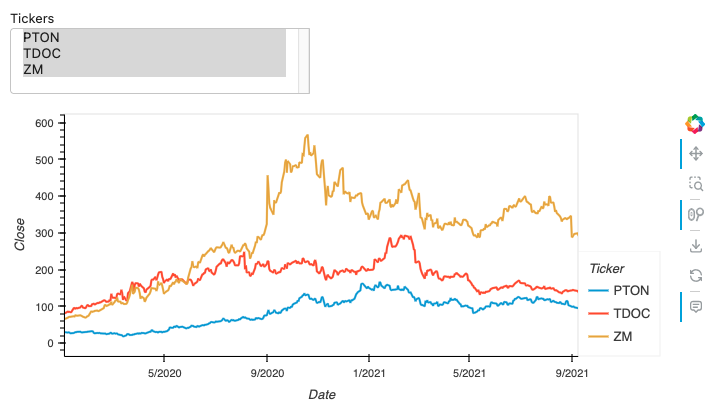
w_tickers = pn.widgets.MultiSelect(name='Tickers', value=all_tickers, options=all_tickers)
# Use the hvplot interactive API to create a pipeline that depends on this widget
one_tickeri = ticker_df.interactive()
one_tickeri = one_tickeri[one_tickeri['Ticker'].isin(w_tickers)]
ploti = one_tickeri.hvplot.line(x='Date', y='Close', by='Ticker')
# Displaying/Serving this pipeline includes its inputs (one widget in this case)
# and its output (one plot).
pn.panel(ploti).servable()
Except in a few cases (the most notable one being Button.on_click), you don’t set up interactivity with on_<event> callbacks in Panel. How to add interactivity to a Panel app is described in this section of the How-To guide.