Hi everyone,
I’m very excited to be able to showcase my first panel application! I’ve started using panel back in march when I was working from home with some time to learn something new. I was developing scientific software to analyze HDX-MS data and needed a GUI to allow all other members in the lab to use it.
I had some experience with making GUIs for scientific software with TkInter, wxWidgets, enaml and Qt and my experience with this was that it was always extremely painful. Not only do you have to write a lot of code to define a widget, place it in your layout, attach the watchers/events and then try to keep the information flow going in the right order, but for me maintaining this in a scientific lab environment was a huge hassle. People were using mac/PC, which meant slight differences in the GUIs, and when there was an update to the software (which was very frequent), I had to repack the software (pyinstaller, etc), and get it to be distributed to all users (which was about 3 people but still a lot of work). For these reasons I decided to forgo a GUI for my previous project ColiCoords.
A while back I was talking with a colleague about what the solution to these problems would be. We (both not programmers background) thought of something where the GUI would be browser-based, with a centralized server on which the analysis runs such that everyone always has access to the most recent version of the software, without the need of installing anything or without platform issues. At that time, however we considered this to be virtually impossible, at least not with a reasonable amount of time investment. And now it turns out, a bit more than a year later, when you’ve learned to use panel, its very easy to achieve exactly this!
The code for the project is available on GitHub: https://github.com/Jhsmit/PyHDX
The project consists of three (highly overlapping) apps: http://pyhdx.jhsmit.org/
At the moment this is hosted on our lab-PC, so its likely not 100% of the time up as its being used for other data analysis jobs.
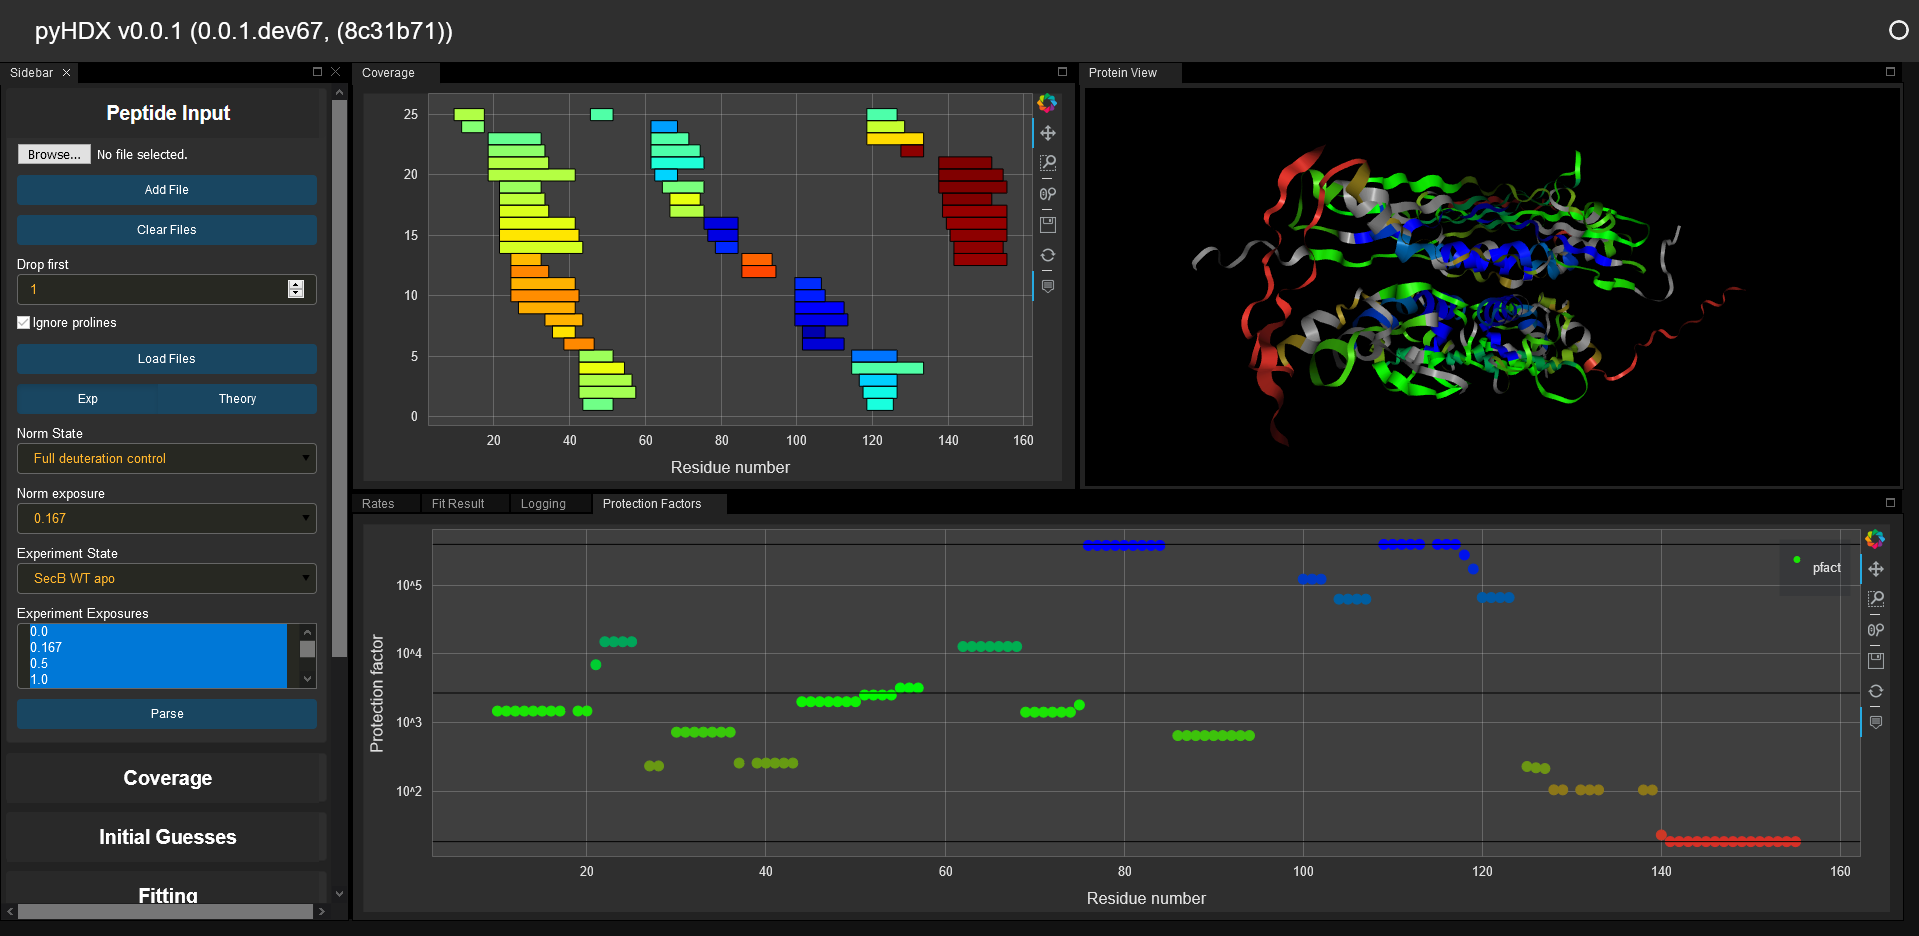
Layout
I’ll use this post to describe the main layout of the app, which I found the most challenging part, and highlight some of the features/widget which might be useful for others. When I started out with the project, I had no experience with panel/param/bokeh, so I decided at against using holoviews since it added a lot of complexity and I wanted to learn the basics of bokeh. When I look at some holoviews functionality now and some of the things I’ve implemented, I think in the future I might want to start looking at holoviews and implement some of the functionality.
The app runs on panel > 0.10.x, and I use a combination of the GoldenTemplate / GoldenDarkTheme and @Leonidas’ Elvis layout system (which makes GoldenElvis  ). I’ve modified the standard golden template to include a fixed side bar, with a flexible main area, whose layout is defined by Elvis (row/column/stack). The side bar has all the buttons/fields/dropdowns (
ControlPanel) while the main area has all the graphs/figures (FigurePanel)
Controllers
Each application is organized through a subclass of MainController. This controller has a list of sub-controllers (control_panels) and a list of ‘views’ (figure_panels). It initializes all these classes and passes a reference to self so that all can access the MainController instance through their parent attribute.
The control panels are subclasses of ControlPanel, which has some functions which are responsible for taking all the params on the Controller and turning them into a list of widgets, which is then displayed as a pn.Card in the sidebar.
These ControlPanels are agnostic of which figures are living in this particular app, such that its easier to mix and max ControlPanels and FigurePanels. When users press some buttons to start an analysis, they use data models available on the MainController (parent) and any output that needs to be plotted is packaged into a DataSource class. This is made available to FigurePanels through the function publish_data on the main controller.
Figure Panels
The figure panels have a function _parent_sources_updated which is triggered when new data sources are made available through the publish_data function on the main controller. Subclasses of FigurePanel have an accepted_tags attribute and the data sources are checked against these tags to see if the new data source is something that this particular figure accepts. The method render_sources is then called, which on BokehFigurePanels automatically renders the data depending on kwargs specified to the data source when it was created. This can be overridden by subclasses for different behaviour. When a data source is added to a figure, a callback is added to the data attribute of its ColumnDataSource, such that if the data is modified (x, y data, or colors), the plot is automatically updated by triggering the object param of the Bokeh pane.
Features
- Asynchronous fitting with
dask. Typically, there are several hundred computational tasks that needs to be completed to generate initial guesses for the analysis. This is done in parallel while keeping the GUI responsive. - Fitting with TensorFlow. Because of the size of the fit (several hundred parameters), the fitting in the second step is done with TensorFlow. This is still a bit of a work in progress because it should also be done in the background and load balanced across 2 GPUs but I haven’t gotten that to work yet.
- Linking the X range of multiple bokeh graphs (and turning this on and off). However, this is turned off at the moment due to some bugs, but this took my a while to figure out how to do.
Widgets
- Protein viewer based on NGL viewer: https://nglviewer.org/ code
- Numeric input with bounds: https://github.com/holoviz/panel/issues/1128#issuecomment-693553886
- AsyncProgressBar: code
- Markdown log window: code
- And this is the big one:
ColoredStaticText: code I think for this one I added a css class somewhere
There are still many bugs and there are many parts where I really had no idea what I was doing and I’m sure there can be a lot of improvements.
As the server might be down here is a video of the GUI in action:
Supplementary Movie 1