Hi there, I have a question on how to keep the x and y axis ranges when changing variables in a Panel dashboard. This is similar to the question at Not change Bokeh axes limits with Dynamic Map, but on a pandas DataFrame instead of an xarray Dataset. Here’s a minimal code example:
# %%
import numpy as np
import pandas as pd
import panel as pn
import hvplot.pandas

# Example pandas dataframe with x, y, z1 and z2 columns
data = 10 * np.random.rand(100, 4)
df = pd.DataFrame(data=data, columns=["x", "y", "z1", "z2"])
#           x         y        z1        z2
# 0  8.366391  4.803666  2.127830  9.435238
# 1  5.480135  1.173533  2.834300  8.722445
# 2  9.859487  6.385979  9.566771  2.205684
# 3  8.638108  0.138157  9.362423  3.890024
# 4  4.635330  9.695100  4.315197  3.976624
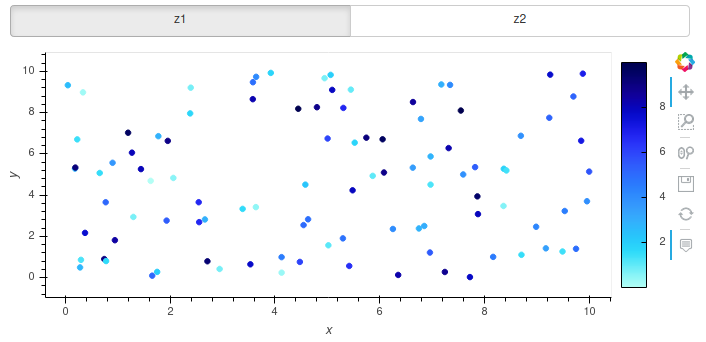
# Create dashboard widget to toggle between z1 and z2
plot = lambda zvar: df.hvplot.scatter(x="x", y="y", c=zvar)
layout: pn.layout.Column = pn.interact(
    plot,
    zvar=pn.widgets.RadioButtonGroup(
        name="z variable", value="z1", options=["z1", "z2"]
    ),
)
dashboard: pn.layout.Column = pn.Column(layout[0][0], layout[1][0])
dashboard
Currently I can zoom in and out of the xy scatter plot just fine, but when I change ‘c’ to color based on the ‘z2’ column instead of ‘z1’, the zoom resets to the original plot. Is there a way to keep the zoom level as it is when switching columns?
I’ve tried using framewise=False but that didn’t work (zoom level will still reset), and I’ve also looked at https://examples.pyviz.org/nyc_taxi/dashboard.html (live demo at https://nyc-taxi.pyviz.demo.anaconda.com/dashboard) which is a lower-level holoviews/param based method, but it’s a lot more code to write compared to hvplot!
In order to keep the zoom level, you can use a RangeXY stream to get the axes ranges then set the range manually when you switch between plots.
You can do that in a param.Parameterized class :
import numpy as np
import pandas as pd
import panel as pn
import hvplot.pandas
from holoviews import streams
import param

class AppTest(param.Parameterized):
    data = 10*np.random.rand(100,4)
    df = pd.DataFrame(data=data,columns=['x','y','z1' ,'z2'])
    color_val = param.Selector(default='z1',objects=['z1','z2'])
    plot = df.hvplot.scatter(x='x',y='y',c='z1')
    startX,endX = plot.range('x')
    startY,endY = plot.range('y')

    def keep_zoom(self,x_range,y_range):
        self.startX,self.endX = x_range
        self.startY,self.endY = y_range

    @param.depends('color_val')
    def view(self):
        self.plot = self.df.hvplot.scatter(x='x',y='y',c=self.color_val)
        self.plot = self.plot.redim.range(x=(self.startX,self.endX), y=(self.startY,self.endY))
        rangexy = streams.RangeXY(source = self.plot, x_range=(self.startX,self.endX), y_range=(self.startY,self.endY))
        rangexy.add_subscriber(self.keep_zoom)
        return self.plot

viewer = AppTest()
pn.Column(pn.Param(viewer.param,widgets={'color_val':pn.widgets.RadioButtonGroup}),viewer.view)
Awesome, thank you so much for this! Good to know that there’s a way to accomplish this in hvplot! Glad to see that the param selector can be wrapped by panel widgets too! 
Just another (hopefully quick) question, is there a way to keep the wheel zoom on by default? When toggling between ‘z1’ and ‘z2’, the wheel zoom tool gets deactivated and I have to reactivate it each time.
You can choose which tools you want to activate by default with the option active_tools.
In this example, you just need to change the first line of the view function by :
self.plot = self.df.hvplot.scatter(x='x',y='y',c=self.color_val).opts(active_tools=['pan','wheel_zoom'])
1 Like
I have the same problem but this solution is not working for me. I’m using Holoviews 1.14.0 and hvplot 0.7.0. The Web console complains about ReferenceError on the JavaScript side but I don’t know any more than that.
Thanks!