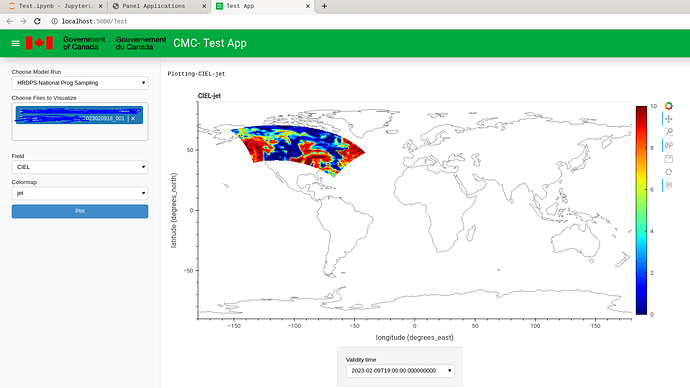
It turns out the problem was with project-True as it was trying to define some immutable numpy arrays in the background and depending on what projection and in what format (not all CRS object are equally precise) so I settled for proj4 for the moment and am trying to find a way to improve my code. If anyone has any ideas or suggestions please do not hesitate. Here is my current working code.
import glob
import collections
import cartopy.crs as ccrs
import hvplot.xarray
import panel as pn
import panel.widgets as pnw
import xarray as xr
import fstd2nc
import warnings
from pyproj.crs import CRS as pcc
from pathlib import Path

collections.Callable = collections.abc.Callable
warnings.simplefilter(action='ignore', category=FutureWarning)

pn.extension(sizing_mode = 'stretch_width', template="material")
pn.state.template.param.update(
    logo="https://www.canada.ca/etc/designs/canada/wet-boew/assets/sig-blk-en.svg",
    site="CMC",
    title="FST Visualizer"
)
file_selector = pnw.FileSelector('~', only_files=True, show_hidden=True)
field_selector = pnw.Select(name="Field")
cmap_sel = pnw.Select(
    name="Colormap",
    value="jet",
    options=["cool", "hot", "jet", "viridis", "brg", "rainbow"]
)
out_button = pnw.Button(name='Plot', button_type='primary')
output_card = pn.Card( title='Interactive Plot' )

def get_hvplot(xr_dataset):
    if 'grid_mapping' in xr_dataset[field_selector.value].attrs:
        crs_native = xr_dataset[field_selector.value].attrs.get('grid_mapping')
        if crs_native == 'rotated_pole':
            return xr_dataset[field_selector.value].hvplot(
                kind="quadmesh",
                rasterize=True,
                data_aspect=1,
                frame_height=550,
                cmap=cmap_sel.value,
                crs=pcc.from_cf(xr_dataset.rotated_pole.attrs).to_proj4(),
                projection=ccrs.PlateCarree(),
                project=True,
                geo=True,
                coastline=True,
                global_extent=True,
                clabel='Units',
                widget_location='bottom_right'
            )
        elif crs_native == 'crs_latlon':
            return xr_dataset[field_selector.value].hvplot(
                kind="quadmesh",
                rasterize=True,
                data_aspect=1,
                frame_height=550,
                cmap=cmap_sel.value,
                projection=ccrs.PlateCarree(),
                geo=True,
                coastline=True,
                global_extent=True,
                clabel='Units',
                widget_location='bottom_right'
            )
        else:
            return pn.pane.Str(f'{crs_native} Grid Mapping')
    else:
        return pn.pane.Str(f'Other {crs_native}')

def output_button_click_handler(event):
    output_card.objects.clear()
    ob_xd = fstd2nc.Buffer(file_selector.value, rpnstd_metadata=True, opdict=True).to_xarray()
    output_card.append(get_hvplot(ob_xd))

def file_selector_value_handler(event):
    file_selector_xd = fstd2nc.Buffer(event.new, rpnstd_metadata=True, opdict=True).to_xarray()
    field_selector.options = sorted(list(file_selector_xd.data_vars))
    field_selector.value = sorted(list(file_selector_xd.data_vars))[0]

file_selector.param.watch(file_selector_value_handler, 'value')
out_button.on_click(output_button_click_handler)

pn.Card(
    pn.Row(
        file_selector
    ),
    pn.Row(
        field_selector,
        cmap_sel
    ),
    pn.Row(
        out_button
    ),
    title='Select files and configure the plot in this collapsible card'
).servable(target='main')

output_card.servable(target='main')
