Update plot when dataframe changes

Hi everyone,

I would like to know how to update a given plot generated by:

df.hvplot(x="x", y="y", by="type", kind="scatter")

if I change the definition of df

Actually, I want to integrate it within the render method of stable_baselines3 custom-environment to see the progress of my learning - I want to visualize my agents position! So far, I have seen some examples that use streamz but could make it to work for my case.

In general, how would we update the data behind a given plot?

Thanks,
Sam

A way to do this is using bind and interactive (even though I’m using a fraction of its power)


import hvplot.pandas  # noqa
import pandas as pd
import panel as pn

pn.extension()


def function_to_generate_dataframe(x):
    # x only used to trigger the function
    df = pd._testing.makeDataFrame()
    df["C"] = df["C"].round()
    return df


widget = pn.widgets.IntSlider(end=100)
hvplot.bind(function_to_generate_dataframe, widget).interactive().hvplot.scatter(x="A", y="B", by="C")

Thanks for the response. That looks like a very concise code.

I see that you can bind it to a widget. But how could we bind it to a function call (or maybe a Button widget?)?
E.g., whenever a function is called, a given plot (already in the Jupyter Notebook/dashboard) gets updated … using matplotlib, I guess we do it using the ax of the figure!

Thank you for bearing with my naivity.

Sam

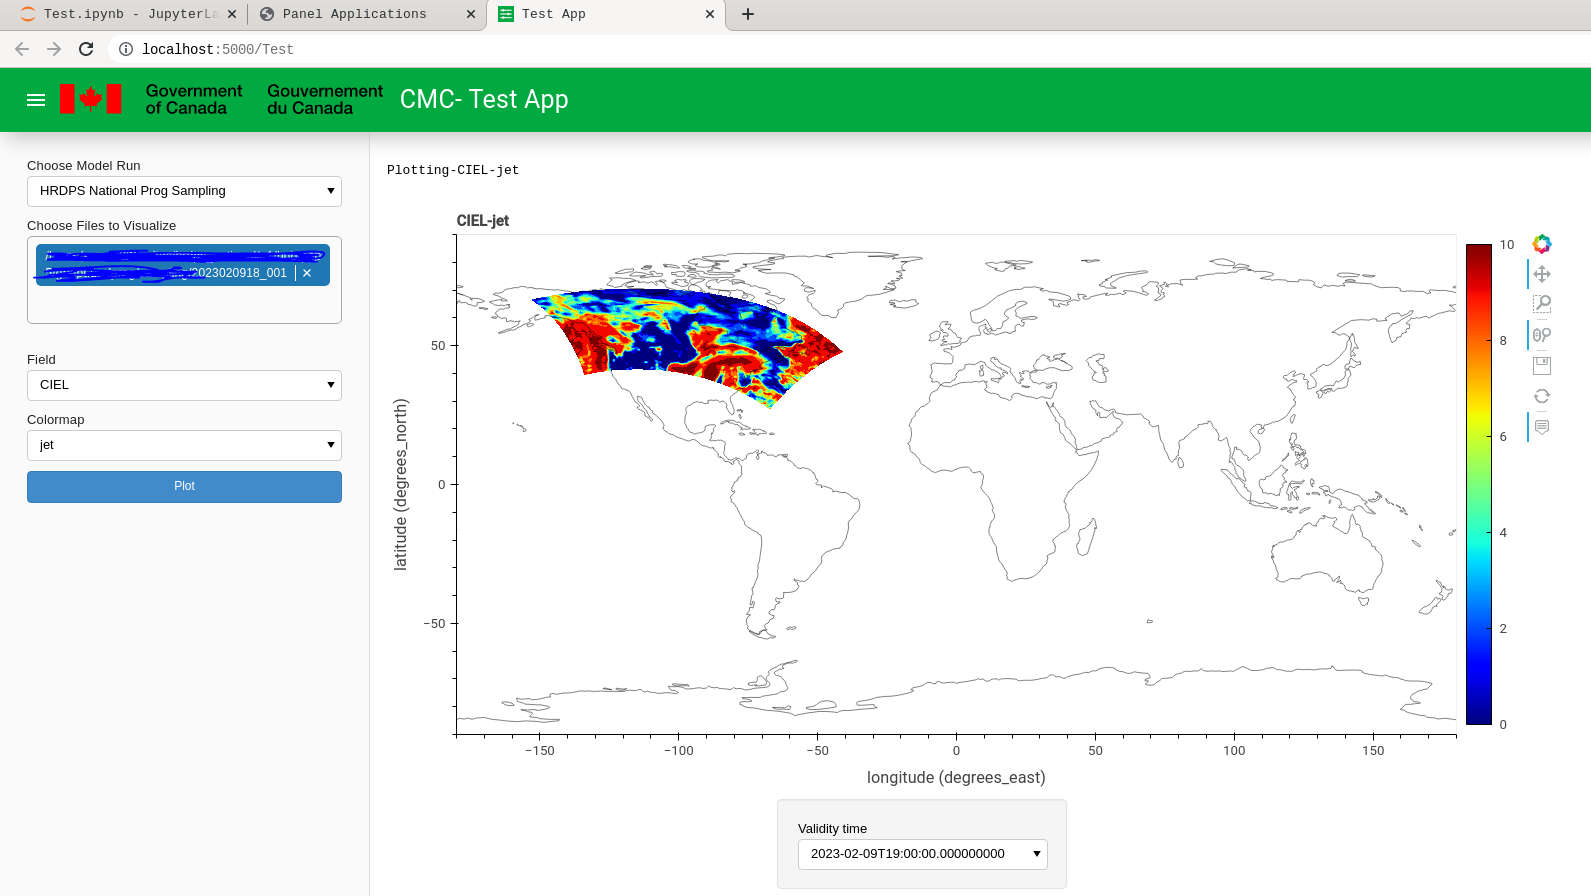
Mr. @Hoxbro this does not seem to work with an Xarray source sir. It keeps giving me Layout errors or that I am passing a function and not a Xarray Dataset. Is there a different way to update an existing hvplot based on an Xarray? (this is related to this question here)

def get_xds(event) -> xr.Dataset:
    if len(files_select.value) == 0:
        return xd_initial
    else:
        xd = fstd2nc.Buffer(files_select.value).to_xarray()
        return xd[select_field.value]
    
hvplot.bind(get_xds, out_button).interactive().hvplot(
                kind="quadmesh",
                rasterize=True,
                data_aspect=1,
                frame_height=500,
                cmap=cmap_sel.value,
                crs=ccrs.PlateCarree(),
                projection=ccrs.PlateCarree(),
                project=True,
                geo=True,
                coastline=True,
                global_extent=True,
                widget_location='bottom',
                title=f'{select_field.value}-{cmap_sel.value}'
            )

where there are widgets in the sidebar that update the cmap and data_vars plotted and themselves are updated dynamically. Imanaged to get it working for an initial dataset but if I try to switch to another dataset it crashes the whole panel server.

There should be, if you provide me with a small example I can run I will take a look at it.

Here is the full app at the moment and I am uploading some dummy data :
2022072100_001.nc - Google Drive, 2022072100_024.nc - Google Drive, 2022072100_036.nc - Google Drive, 2022072100_012.nc - Google Drive, 2022072100_048.nc - Google Drive

The idea is for the user to be able to select a folder then MultiChoice files from that folder which when they click the plot button (or even better without clicking) we plot the Xarray Dataset created from loading files form the MultiChice widget. At the moment I can do this but as mentioned in the question I referenced above, I get a weird error tellimg the hvplot object is read-only and that I can not update it.

import glob
import cartopy.crs as ccrs
import hvplot.xarray
import panel as pn
import panel.widgets as pnw
import xarray as xr
import cartopy

pn.extension(sizing_mode = 'stretch_width', template="material")

base_path_options = {
    'HRDPS National Prog Sampling':  '/PATH_TO_FILES_1/*' ,
    'HRDPS National Diag':   '/PATH_TO_FILES_2/*',
    'GDPS Prog Sampling':  '/PATH_TO_FILES_3/*',
}

base_path_select = pnw.Select(name='Choose Model Run',options=base_path_options)
file_list = sorted(glob.glob('/PATH_TO_FILES_1/*'))
files_select = pnw.MultiChoice(name='Choose Files to Visualize',options=file_list) #,value=[file_list[0]])

xd_initial = xr.open_dataset(file_list[0])

select_field = pnw.Select(name="Field",options=list(xd_initial.data_vars)) # , value=list(xd.data_vars)[0)
cmap_sel = pnw.Select(
    name="Colormap",
    value="jet",
    options=["cool", "hot", "jet", "viridis", "brg", "rainbow"]
)

def update_file_list_options(event):
    file_list = glob.glob(event.obj.value)
    files_select.options = file_list
    
base_path_select.param.watch(update_file_list_options, 'value')

def update_field_select_options(event):
    print(f'Field - {event.obj.value}')
    if len(event.obj.value) == 0:
        return ['Empy', 'Empty', 'Empty']
    else:
        temp_xd = xr.open_dataset(event.obj.value)
        temp_options = sorted(list(temp_xd.data_vars))
        select_field.options = temp_options

files_select.param.watch(update_field_select_options, 'value')

out_button = pnw.Button(name='Plot', button_type='primary')

out_pane = pn.Column(name='Outputs')
out_pane.append(
            pn.pane.Str(f'Empty-{select_field.value}-{cmap_sel.value}')
        )
pn.Column(
    base_path_select,
    files_select,
    select_field,
    cmap_sel,
    out_button
).servable(target='sidebar')


def get_output(event):
    if len(files_select.value) == 0:
        out_pane.clear()
        out_pane.append(
            pn.pane.Str(f'Empty-{select_field.value}-{cmap_sel.value}')
        )
    else:
        xd = xr.open_dataset(files_select.value)
        xds = xd[select_field.value]
        out_pane.clear()
        out_pane.append(
                xds.hvplot(
                kind="quadmesh",
                rasterize=True,
                data_aspect=1,
                frame_height=500,
                cmap=cmap_sel.value,
                crs=ccrs.PlateCarree(),
                projection=ccrs.PlateCarree(),
                project=True,
                geo=True,
                coastline=True,
                global_extent=True,
                widget_location='bottom',
                title=f'{select_field.value}-{cmap_sel.value}'
            )
        )
out_button.on_click(get_output)

out_pane.servable(target='main')

Can you try to reduce it down to a small example and not the full code? I think this can be reduced a bit.

It will also be helpful if you remove the fstd2nc decency.

1 Like

With the last edits you no longer need fstd2nc it will work with the NetCDF files I have shared. as for the rest I am not sure how to simplify it as it is just a couple of definitions of widgets and some bindings. I am fairly novice so if you think I can improve my code just point me in the right direction sir and thank you so much for your time.

I think you forgot to clear your notebook before updating your example. It still has
xd_initial = fstd2nc.Buffer(file_list[0]).to_xarray().

Is it possible to create a function that creates small and fake data? It does not need to have a lot of values but needs to have the same structure as the original.

1 Like

Yes you were correct I forgot to save before exporting. The whole is a bit dependant on where you will keep the NetCDF files but other than that I think it is fine.

This does not solve all your problems, but it ticks off a few of them:

import glob
from functools import lru_cache

import cartopy
import cartopy.crs as ccrs
import hvplot.xarray
import panel as pn
import panel.widgets as pnw
import xarray as xr

pn.extension(sizing_mode="stretch_width", template="material")

base_path_options = {
    "HRDPS National Prog Sampling": "/home/shh/Downloads/*nc",
    "HRDPS National Diag": "/home/shh/Downloads/*nc",
    "GDPS Prog Sampling": "/home/shh/Downloads/*nc",
}

base_path_select = pnw.Select(name="Choose Model Run", options=base_path_options)
file_list = sorted(glob.glob("/home/shh/Downloads/*.nc"))
files_select = pnw.MultiChoice(name="Choose Files to Visualize", options=file_list)

xd_initial = xr.open_dataset(file_list[0])

select_field = pnw.Select(name="Field", options=list(xd_initial.data_vars))
cmap_sel = pnw.Select(
    name="Colormap",
    value="jet",
    options=["cool", "hot", "jet", "viridis", "brg", "rainbow"],
)


def update_file_list_options(event):
    file_list = glob.glob(event.obj.value)
    files_select.options = file_list


base_path_select.param.watch(update_file_list_options, "value")


def update_field_select_options(event):
    print(f"Field - {event.obj.value}")
    if len(event.obj.value) == 0:
        return ["Empy", "Empty", "Empty"]
    else:
        temp_xd = xr.open_dataset(event.obj.value)
        temp_options = sorted(list(temp_xd.data_vars))
        select_field.options = temp_options


# files_select.param.watch(update_field_select_options, "value")  # This raised an error for me and seem to be out of scope

out_button = pnw.Button(name="Plot", button_type="primary")

out_pane = pn.Column(name="Outputs")
pn.Column(base_path_select, files_select, select_field, cmap_sel, out_button).servable(
    target="sidebar"
)


@lru_cache
def _create_plot(file):
    xd = xr.open_dataset(file)
    return xd.hvplot(
        kind="quadmesh",
        rasterize=True,
        data_aspect=1,
        frame_height=500,
        cmap=cmap_sel.value,
        crs=ccrs.PlateCarree(),
        projection=ccrs.PlateCarree(),
        project=True,
        geo=True,
        coastline=True,
        global_extent=True,
        widget_location="bottom",
        title=f"{file}-{select_field.value}-{cmap_sel.value}",
    )


def get_output(event):
    files = files_select.value
    if files:
        new = [_create_plot(file) for file in files]
    else:
        new = [pn.pane.Str(f"Empty-{select_field.value}-{cmap_sel.value}")]

    out_pane[:] = new


out_button.on_click(get_output)

pn.Column(out_button, files_select, out_pane, min_height=400)
1 Like

Thank you for the lead Mr. @Hoxbro, I am currently testing it out but definitely found that my exact starter code without project=True seems to work a lot better and now I am hitting different errors at least. I will report back here ASAP so do not take the delay as a sign of disinterest, I very much appreciate your help.

It turns out the problem was with project-True as it was trying to define some immutable numpy arrays in the background and depending on what projection and in what format (not all CRS object are equally precise) so I settled for proj4 for the moment and am trying to find a way to improve my code. If anyone has any ideas or suggestions please do not hesitate. Here is my current working code.

import glob
import collections
import cartopy.crs as ccrs
import hvplot.xarray
import panel as pn
import panel.widgets as pnw
import xarray as xr
import fstd2nc
import warnings
from pyproj.crs import CRS as pcc
from pathlib import Path

collections.Callable = collections.abc.Callable
warnings.simplefilter(action='ignore', category=FutureWarning)

pn.extension(sizing_mode = 'stretch_width', template="material")
pn.state.template.param.update(
    logo="https://www.canada.ca/etc/designs/canada/wet-boew/assets/sig-blk-en.svg",
    site="CMC",
    title="FST Visualizer"
)
file_selector = pnw.FileSelector('~', only_files=True, show_hidden=True)
field_selector = pnw.Select(name="Field")
cmap_sel = pnw.Select(
    name="Colormap",
    value="jet",
    options=["cool", "hot", "jet", "viridis", "brg", "rainbow"]
)
out_button = pnw.Button(name='Plot', button_type='primary')
output_card = pn.Card( title='Interactive Plot' )

def get_hvplot(xr_dataset):
    if 'grid_mapping' in xr_dataset[field_selector.value].attrs:
        crs_native = xr_dataset[field_selector.value].attrs.get('grid_mapping')
        if crs_native == 'rotated_pole':
            return xr_dataset[field_selector.value].hvplot(
                kind="quadmesh",
                rasterize=True,
                data_aspect=1,
                frame_height=550,
                cmap=cmap_sel.value,
                crs=pcc.from_cf(xr_dataset.rotated_pole.attrs).to_proj4(),
                projection=ccrs.PlateCarree(),
                project=True,
                geo=True,
                coastline=True,
                global_extent=True,
                clabel='Units',
                widget_location='bottom_right'
            )
        elif crs_native == 'crs_latlon':
            return xr_dataset[field_selector.value].hvplot(
                kind="quadmesh",
                rasterize=True,
                data_aspect=1,
                frame_height=550,
                cmap=cmap_sel.value,
                projection=ccrs.PlateCarree(),
                geo=True,
                coastline=True,
                global_extent=True,
                clabel='Units',
                widget_location='bottom_right'
            )
        else:
            return pn.pane.Str(f'{crs_native} Grid Mapping')
    else:
        return pn.pane.Str(f'Other {crs_native}')
        
def output_button_click_handler(event):
    output_card.objects.clear()
    ob_xd = fstd2nc.Buffer(file_selector.value, rpnstd_metadata=True, opdict=True).to_xarray()
    output_card.append(get_hvplot(ob_xd))

def file_selector_value_handler(event):
    file_selector_xd = fstd2nc.Buffer(event.new, rpnstd_metadata=True, opdict=True).to_xarray()
    field_selector.options = sorted(list(file_selector_xd.data_vars))
    field_selector.value = sorted(list(file_selector_xd.data_vars))[0]

file_selector.param.watch(file_selector_value_handler, 'value')
out_button.on_click(output_button_click_handler)

pn.Card(
    pn.Row(
        file_selector
    ),
    pn.Row(
        field_selector,
        cmap_sel
    ),
    pn.Row(
        out_button
    ),
    title='Select files and configure the plot in this collapsible card'
).servable(target='main')

output_card.servable(target='main')