Very interesting thread, and news!
Question: as a newbie, is the investment worth, moving from using a tools that works already (with #holoviews and #panel), and what would be the advantage?
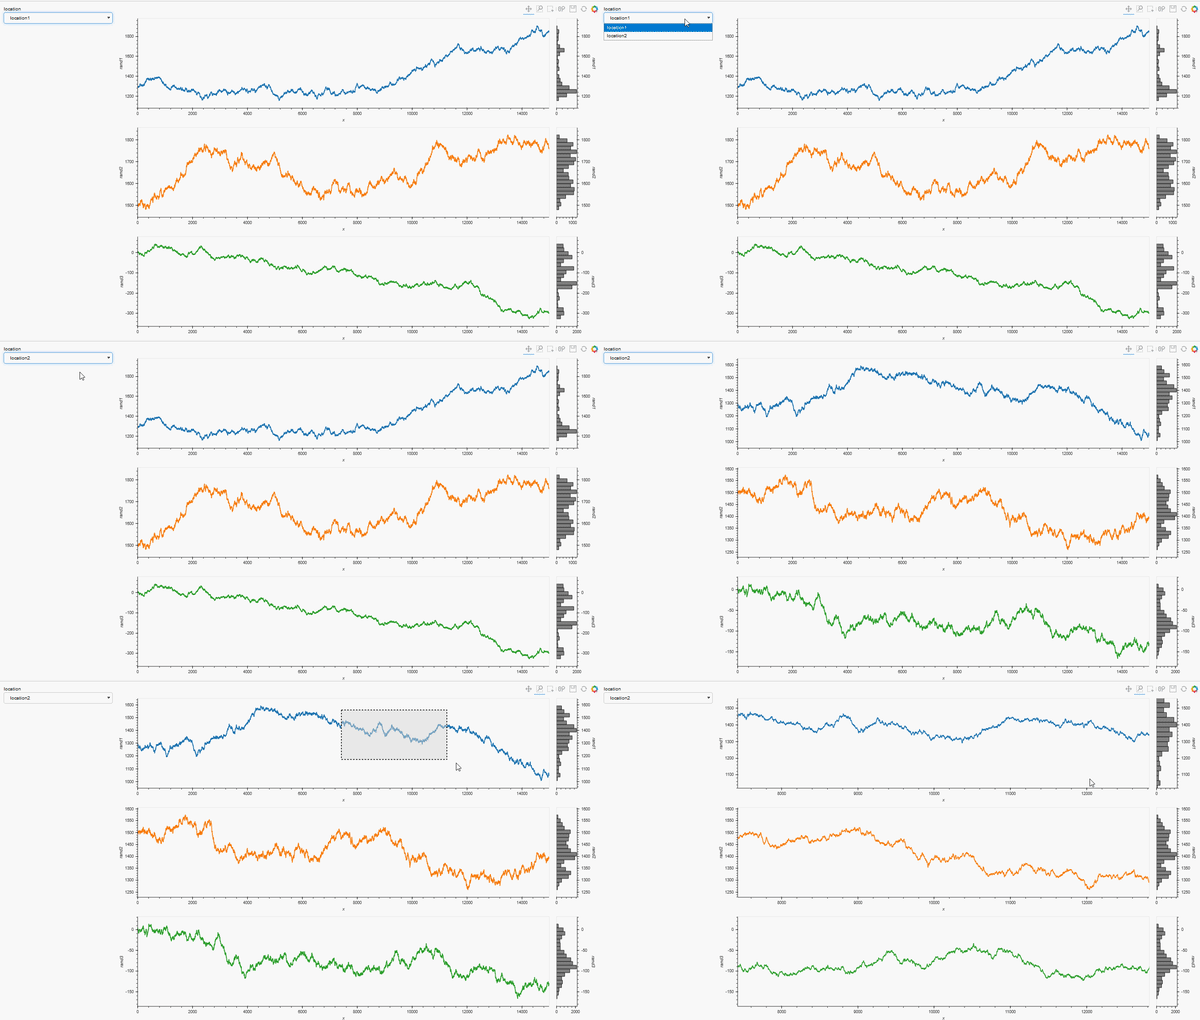
For example, as a follow-up to my HoloViews question I built this complete Panel app:
## Preliminaries ##
import pandas as pd
import numpy as np
import panel as pn
import holoviews as hv
from holoviews.util.transform import dim
from holoviews.selection import link_selections
from holoviews import opts
from ipywidgets import interactive, interact, Select
import hvplot.pandas
hv.extension('bokeh', width=100)

## Data generation ##
data_df1= pd.DataFrame()
npoints=15000
np.random.seed(71)
x = np.arange(npoints)
y1 = 1300+2.5*np.random.randn(npoints).cumsum()
y2 = 1500+2*np.random.randn(npoints).cumsum()
y3 = 3+np.random.randn(npoints).cumsum()
data_df1.loc[:,'x'] = x
data_df1.loc[:,'rand1'] = y1
data_df1.loc[:,'rand2'] = y2
data_df1.loc[:,'rand3'] = y3
data_df1.loc[:,'location'] = 'location1'
data_df2= pd.DataFrame()
np.random.seed(81)
y1 = 1300+2.5*np.random.randn(npoints).cumsum()
y2 = 1500+2*np.random.randn(npoints).cumsum()
y3 = 3+np.random.randn(npoints).cumsum()
data_df2.loc[:,'x'] = x
data_df2.loc[:,'rand1'] = y1
data_df2.loc[:,'rand2'] = y2
data_df2.loc[:,'rand3'] = y3
data_df2.loc[:,'location'] = 'location2'
data_df = pd.concat([data_df1, data_df2])

## App preliminaries ##
pn.extension()
hv.opts.defaults( hv.opts.Histogram(fill_color='gray'))

## Location selection widget ##
locations = list(data_df['location'].unique())
loctn=pn.widgets.Select(options = locations, value = locations[0], name = 'location')

## Panel App via reactive function ##
@pn.depends(loctn.param.value)
    def plot_locations(loctn):
        dt = data_df.loc[data_df['location']==loctn]
        colors = hv.Cycle('Category10').values
        series   = ['rand1', 'rand2', 'rand3']
    layout = hv.Layout([hv.Curve(dt, 'x', lc).opts(height=300, width=1200, color=c).hist(lc) for c,
                        lc in zip(colors,[d for d in series])])
    return link_selections(layout).cols(1)
pn.Row(loctn, plot_locations)
