I recently noticed that the forum has this Introductions page and since the forum has been open for quite some now (more than a year I believe!) it’s due time for proper introductions
I’m going to start with my own and will ping a few people just to get things going, and I encourage you to do the same thing. Feel free to do it however you like it or just to ignore the ping! Just to give you an idea, here are a few questions you could answer in your introduction:
Kicking this off, so my name’s Maxime and I’m French but currently lives in Germany. I’ve got a background in civil engineering, more precisely I’ve worked as a flood risk engineer, specialized in making flood maps based on hydraulic simulations. I’ve always had to code a little bit in my work, and a few years ago I really got into Python. I found amazing the things that could be achieved with just a few lines of code (and finding the right library to do the work of course!).
I don’t remember how exactly I came to know about the Holoviz tools but I do remember being literally blown away by the concept of Panel. Suddenly, knowing Python allowed me to create reactive dashboards. That was just too much power in my hands ! This is probably the first app I’ve created with Panel, I wanted to show my colleagues that it was possible to somehow replicate Vigicrues (a French website to visualize river height and flow). The app is miraculously still live on Heroku, nothing fancy and partially broken, but that was a fun exercise and proof of concept. Panel is also I believe the first open-source project I ever contributed to.
I later finally decided to try my luck at becoming a proper software developer and I was lucky enough (really lucky actually) to find that job Anaconda working with the Holoviz team. It’s been a few months already and it’s been great! What Holoviz users can’t really see and gauge is that there’s a lot of consulting work done by the Holoviz devs. Some of this work goes into creating new libraries (like Lumen for the most recent one), some of it goes into adding new features and fixing bugs in existing libraries, but a great deal of it directly goes into dedicated client’s work. This means that maintaining these tools is no different from most open-source software development, it’s a significant personal investment from the devs, so cheers to them for that !
Hi there. I’m Marc. I have a passion for interactive data and model exploration as well as data apps. I was looking for a powerful framework to use in Python. The best I’ve found is Panel. It still needs a lot of improvement though, so I ended up as a contributor.
What interests me is in particular is 1) being able to collaborate across VS Code, PyCharm, Jupyter and similar environments for people of all skills 2) being able to develop something top notch beautiful and performant 3) being able to utilize modern Python (typehints, async, fast api etc.) 4) being very easy to use 5) and having fun together as a community. There is still some way to go But its getting there.
I try to do my best promoting Panel and Holoviz. Trying to help create a community. So you can find me posting on twitter and LinkedIn.
In my work life I work for Ørsted, the most sustainable energy company in the world four years in a row. My current title is lead trading analyst. My previous was lead data science developer. So I work in that space. I’ve been responsible for developing Market Tradings analytics environment based on k8s, azure and Jupyterhub. So I’m also very motivated by making Panel easy and powerful to use in that environment. For example I was so happy to see the Jupyter Panel Preview come alive. It’s so useful when you work in Jupyterlab on a cloud platform. I also see Jupyter and easy to use data app frameworks like Panel as a key component for transitioning from something Excel and BI Tools can handle to Big Data, Data Science and AI for all kinds of domain experts be it analysts, scientists, engineers, traders etc.
In my private life I enjoy my family (Christel, Laurits, Gustav and Asger), my dog (Dina) and physical activity (cycling, running, kayaking). My son Asger plays a lot of badminton so I spend a lot of time with him in badminton halls all over Denmark.
When you read this please also write something about your self and why you are interested in HoloViz. And then ping some else you would like to tell their story. Thanks.
Ok, I’m Carl and I stay in a little sunny grey spot in the north east of Scotland. From my younger years I have a keen interest in electronics, I still do to this day with something new I flash the first little led I can find and now make little raspberry pi projects. It drove my interest in programming, I don’t call myself a programmer by anymeans I’m more a kwik fit fitter if you like, a pretty bad one but I try - I often don’t fully understand how something works, there’s often magic that goes on, very much like the post man you could say, I don’t know how something gets from a to b but it does and I make use of that service. I very much appreciate the work that goes into making these tools. I sometimes feel are very much underestimated.
I am mostly dealing with fibre optics: pressure gauges, flowmetres and distributed temperature sensing (the latter is being able to use the fibre itself as a temperature measuring tool) & anything else that happens to come my way. This is all related to the oil and gas. Hopefully renewables one day…
I make use of the holoviz suite for both work and pleasure. At work knowing a little about this holoviz ecosystem allows me to sit more closely to the scientists whom I often find still running static graphs from excel. I’m essentially the pipeline of data from source to scientist, extracting, making the network hops and tranforming to whatever, personally I really find the fact you can explore the data so easily with the tools provided here makes it a pleasure to work with. How I came about panel and the other tools was somewhat a long journey, I needed to be able to plot data from some machines that got me involved in Python and Pandas, from there I thought why can’t we have data in the webbrowser rather than multiple apps and sure enough it led me to bokeh / datashader, holoviews and ultimately the holoviz suite of tools.
I struggle with a lot of parts but one area that has always got me is getting the data to whatever app, usually I’ve ended up hard coding a string but I like it to be somewhat flexible but this is where my lack of understanding probably of python more so. Very recently I came across a piece of code by @Marc I think I’ll highlight it because I think it is something that I feel is underestimated in the power it brings to the file input widget for use case scenarios - it certainly has allowed myself to now load multiple sets of data quickly and easily. That coupled with the dashboards I think is just really fantastic. When I start out I’m never sure what direction to take either but if I find something that works for me I just go with it for the most part.
Really though, Panel and the rest of Holoviz tools has become part of my top 10 go to websites I guess that’s how much I like this - maybe I’ll get more time to practice, whilst reading the news I’m keeping up to date with the releases, problems, solutions here and that’s something I enjoy as well as get a kick out of using.
Well pretty much like @maximlt I am a French engineer living working in Germany that turned doing a lot of software development.
I allow to call myself a “data scientist”: doing a lot of stats using code in a specific trade (Li-ion cell manufacturing).
Well along the last decade this term has been tarnished by a buzzing trend called machine learning, which may represent less than 1% of my day-to-day job .
I had started using Matlab at the beginning of the 2010s to make GUIs doing data analytics. That was when I was a master student, then a PhD candidate, in large corporations with Matlab licenses. Then I discovered python and its very powerful open source community. Numpy & pandas were the first clicks that this is my go-to language. I used to develop GUI with (py)Qt. Until my mind was blown away by Bokeh.
I tried to blow other people’s mind by pushing this technology in talks in the local scene. You can’t believe how many Pythonistas would raise their hands when we ask them “Who wants to avoid doing JavaScript at all cost while still serving web apps?”
hvplot made my life a lot easier with Bokeh to do quick analytics, and Panel + param to make clean & maintainable apps running in production. So here I am!
Trying to contribute at the best of my capabilities, which very often end up in pinging Philipp because I am stuck .
Hello everyone, I’m Sophia. My background is in Statistics and Psychology. I went to UT Austin for my education. I am currently a data scientist at Anaconda where I met my best friends and mentors @jbednar, @philippjfr, and @jstevens and learned about HoloViz.
I’m passionate about data visualization and understanding data through visualization. HoloViz is my absolutely favorite Python viz tools. I was very surprised that many data scientists do not know about HoloViz, so I wrote a blog post on why I love HoloViz.
I love writing. I write data science-related topics on my Medium blog. here is a list of blog posts I have written on HoloViz.
For what it’s worth,
I have undergraduate degrees in math and physics, and a Ph.D. in applied math.
I spent my working life developing algorithms and solutions to a lot of rather crazy problems (a lot of signal processing)
Now retired, I still teach at the university level.
I enjoy the outdoors: hiking, kayaking (I used to do whitewater runs, but I am taming it down now).
I speak a number of languages, and am currently working on improving my spanish.
It keeps me busy!
I’m Jim, and I’ve been around since forever. I started working with Python in 2003 when I decided we should rewrite our just started neural simulator project in Python when I was a postdoc. Param was the first bit we wrote, because I’d written something similar in C++ for my PhD work and never wanted to be without that sort of safety net again. In 2004 I became a faculty member at the University of Edinburgh, where we eventually released our simulator at topographica.org (now mostly defunct!). Topographica had a TkInter GUI based on Param, but when Philipp and Jean-Luc started working with me on neural simulation projects they found it too constraining and wanted to use the newly available IPython notebook instead, so Jean-Luc started the project that eventually became HoloViews. For years I told him and Philipp they ought to focus on finishing their PhDs instead of messing around with software, but thankfully they didn’t listen, or we wouldn’t be here today! Eventually they did finish their PhDs and I was ready to see sunshine again, so we all joined Anaconda in 2015 (with me in Austin) and started applying these tools to every area of science, engineering, and analytics, no longer just neuroscience. As part of one consulting project after another, our tools grew more powerful, e.g. Philipp added support for Bokeh to HoloViews while I started the Datashader project with Peter Wang and Jim Crist, and eventually everything came together into the HoloViz ecosystem that gives us superpowers to solve just about any problem our clients throw at us. Nowadays we just try to keep on top of all the issues and releases while we get our day jobs done of keeping our clients happy!
That was an interesting story. I see a lot of parallel with the story behind PyTorch. When are you guys interviewed by your CTO as was Yann LeCun & co. by his on this video PyTorch Turns 5! - YouTube ?
@carl, sounds like we overlap a lot! At least four of the main people on the HoloViz team spent 5-10 years in Scotland, I have family who lived for many years in Elgin, and several of us have been involved in fiber-optic sensing projects for oil wells using Panel…
I’am Nauman from Pakistan Islamabad. My initial work is in ISP in servers administration which later become passion for data exploration using AWK and Perl.
Then after joining in Jazz https://jazz.com.pk/ my basic job is to extract data from multivendor Network Servers and engineered it to for interactive data reports.
Using Emacs and Vim like tools i can reach and do scripting for data exploration efficiently
Started programming in python in 2015 converting network performance complex critical manual Excel reports to automated reports .
Then sharing my data exploration in Jupyter notebooks with my peers.
During 2020 Covid early work from home i started using Panel and Holoviews for automotive interactive dashboard application in comparison to my Tableau Dashboards.
Last year i started using Fastapi+Panel+Holoviews and i can say it is at par with Tableau Dashboards .
That’s good to know about Panel and glad you have made some in roads there, I know two of the larger clients in the North Sea hav had smaller companies that were making use of plotly from what I could tell, it looked good but nothing I didn’t think panel and co can’t manage and sounds like to me it is. Actually the biggest disconnect in the field I find is having 3 or 4 people in the room at the same time when the tools are being devoloped. Somone that understands what is going on with the well, the programmer(s), someone that understands the data inside from a perspective of what is noise, why are there events going on & such and the end user. Maybe more but for me that would be the magic mix to making the best productive user friendly visual suite. All I know from an optics perspective is there is definately room for these tools to shine by bringing multiple data sources together and to make sense of it all in a visually appealling user friendly manner, this is the ticket.
@hyamanieu, that was an interesting video, thanks! Yann and I were co-presenters at a workshop on vision in 2012 when we were both still just professors; interesting that a decade later we are both managing open-source projects for corporations. Much of what he described also applies to my own journey turning arcane research code into tools powering real-world applications. So yes, maybe should get Peter Wang to interview me about that.
Thanks for tagging me! I’m an atmospheric scientist by academic degrees (a Bachelor’s and Master’s), but I consider myself more of a Python developer~ Currently, I am in between jobs, but soon I’ll be starting work at Prefect!
I was initially attracted to HoloViews because of the hover tool and how easy it was to step through timesteps to analyze a dataset, so I used it for my research! And before hvplot was released, it was kind of tedious to set labels and customize plots to make it “publication quality” so I went to develop HoloExt to make my own life easier, and even though it’s now deprecated (unusable), that was when I really learned how to use HoloViews more proficiently!
Eventually, after graduation, I continued using the HoloViz ecosystem a lot for building interactive dashboards at work (people were surprised by how efficiently I was able to create them, thanks to Panel). However, there were still things I couldn’t implement myself so I asked for a lot of help on this discourse. It didn’t feel proper to just ask but not answer others, so I decided to help others too, and I learned a lot through this as well!
Now, I am hoping Panel someday supports mobile app development because that would be super awesome!
Hi, I’m Nestor, an Argentinian researcher on electronic nanodevices (UNSAM - Universidad Nacional de San Martín) and distributed fiber optic systems (https://www.sur-tech.ar/, similar to what @carl commented, some version of the dashboard made with panel can be found here https://discourse.holoviz.org/t/distributed-fiber-optic-sensors-panel-multi-app-with-flask /1508), currently on a two-year sabbatical in Seoul. Throughout my PhD and my first years of research, I used Labview, C and Origin for work. Since mid 2019, when beginning to work with oil companies in distributed fiber optic systems, I started with python for signal analysis and alarm predictions. My collaborators used matplotlib, so a library was needed that could incorporate it to create a dashboard for the operators and supervisors of the oil pipelines that use the systems we developed. That’s how I found the panel library that allows you to combine bokeh with matplotlib, and thus we can use a lot of code already generated in the laboratory. In fact, to this day we still can’t get the same images of certain 1000 * 15000 matrices that plt.imshow provides, and we’re used to seeing it a certain way. The last thing I want to mention is the good community I found here, which helped me a lot in the first times with python and all the stuff, Mark, Philipp, etc… In fact, I still remembered my first PR with one line correction of a relative path for panel.
My name is Mike. I’m a clinical physicist working in radiation therapy. I spend much of my days working in our radiation oncology clinics but have always been interested in data visualization. I got into python during my undergraduate and graduate work and over the years have written a number of small tools and utilities for visualizing the large sums of data that are logged out by the linear accelerators we use to treat our patients. I’m currently the Chief of Radiation Physics for a hospital system in Colorado.
I have recently discovered Panel, Param, and Holoviews and am intrigued by the power of these tools compared to my “out of the box” python code. In an effort to learn the tools in my spare time I have started rewriting my old code specifically to utilize Param which has to be one of my new favorite libraries (I can’t imaging not having it at this point). I’m currently using these tools to develop a dashboard for visualizing trajectories for the radiation beam shaping components in the head of one of our particle accelerators.
I completed graduate work in a few different disciplines so to keep my mind going and my skills at least marketable I take consulting work in a variety of field and have found these visualization tools to be fantastic at just about everything.
In my spare time I like to enjoy hiking, camping, climbing and everything else the Rocky Mountain west has to offer. I really appreciate all of you and the help this group has provided as I have tried to develop the skills necessary to use these tools more effectively.
Welcome everyone and thanks for getting these introductions going! I originally set up this category but somehow managed not to actually write my own introduction…so here it is.
My name is Philipp Rüdiger, I grew up in Berlin but then pursued my academic career in the UK, first in York then in Edinburgh. After initially dabbling in music production (and electronic engineering) I ended up doing my PhD in computational neuroscience under @jbednar along with @jstevens. Initially I performed most of my analyses in MatLab but was quickly converted to Python by Jim and Jean-Luc and haven’t looked back since.
After Jean-Luc developed an initial prototype of HoloViews to visualize modeling output from the neural simulator I found myself needing to visualize not just the temporal evolution of the models but also analyze huge parameter searches. This led me to generalizing HoloViews to work with multi-dimensional parameter spaces and adding many different plot types. After that I spent most days and nights improving HoloViews and making little progress on my PhD. Eventually we were hired by Anaconda and I was able to implement a Bokeh backend and integrate HoloViews tightly with Datashader which had been in development at Anaconda. Oh and also eventually finish my PhD.
Through a consulting engagement with the UK MetOffice I then wrote GeoViews as a GIS extension for HoloViews. This was closely followed by another consulting engagement that allowed me to write hvPlot. It was initially envisioned simply as a plotting extension for the Intake data catalog library but soon took on a life of its own. After writing various prototypes to allow us to build dashboards from notebooks I was eventually given almost a full year in funding to go off and write a whole new solution which ended up becoming Panel and here we are.
These days I spend my days getting Lumen ready for a real release, maintaining and improving Panel and trying to keep up with at least some of the issues on the many other repos we maintain. Additionally I advise our clients on how to best leverage Panel for their use cases and use that experience to drive the development of new Panel features.
I’m really proud and excited to see the community around these tools grow, love seeing all your awesome showcases and most of all love seeing you answering each others questions on this Discourse. This is an exciting time for HoloViz and Panel in particular and as we expand our team we hope to continue growing this community and shipping new features, fixes and documentation more frequently.
Raghu here, a mechanical engineer who likes to code. Have implemented interactive visualizations utilizing Bokeh for engineering or scientific simulations. Lead an open source project for utilizing interactivity in STEM based classrooms. Happy to report it has at least touched 20-30 students in a classroom. Here are some of our sample work:
I have a use case for utilizing Panel and HoloViews and was planning to start a community thread as a Q&A to walk through the design and update progress. If this is discouraged, please let me know and I will post only if I hit some roadblocks and need help.
The reaction kinetics app looks fabulous! Please add that to the Showcase section. Yes, please do open a new topic for anything that might be of interest to the community or where you want feedback.

 This is probably the
  !
! But its getting there.
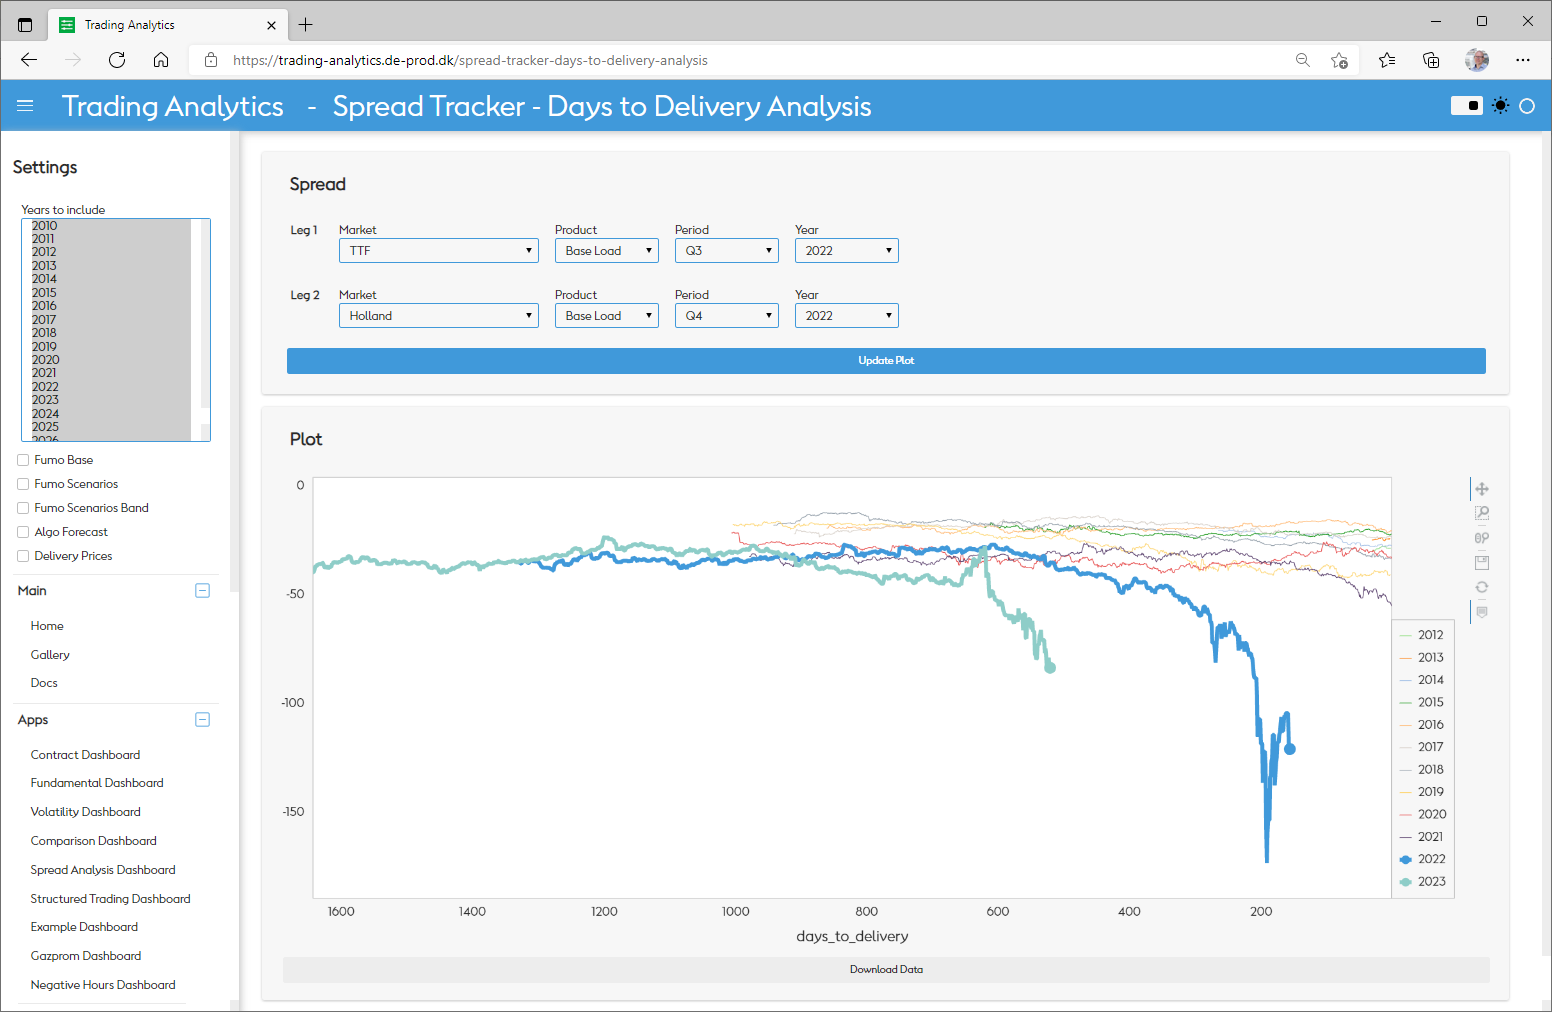
 .
.
 Currently, I am in between jobs, but soon I’ll be starting work at Prefect!