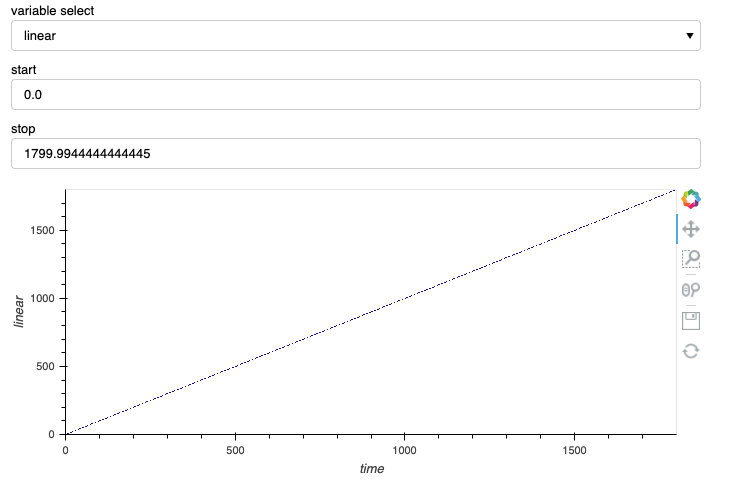
I have an application where I would like to zoom in on time series data and then switch variables to see what the values look like in that same range. The below code performs that function however the issue I am seeing is that when I try to reset the graph to the default view it thinks the reset range is that of the zoomed in range. Any help or ideas would be greatly appreciated.
Thank you for the response. I am sorry I took so long to respond back but I hadn’t used DynamicMaps before so I had to figure out how to pass it to datashader. I did try with a dynamicmap and it works! Another benefit is it seems I can ignore using streams now also.
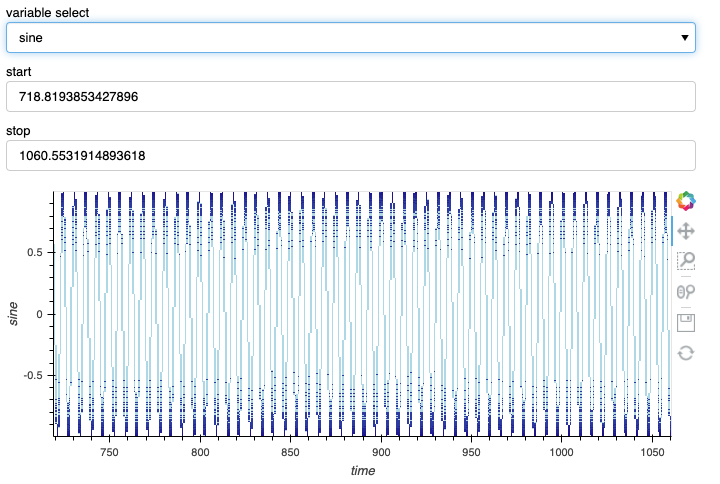
Only problem is that now both the x and y axis and kept and the original values when switching. Previously the y axis was able to resize which is the correct functionality. Here is the updated code, any suggestions on how to make it so that the y axis resizes properly within that selected window?
import numpy as np
import pandas as pd
import sys

import holoviews as hv
from holoviews.operation.datashader import datashade
from holoviews.streams import RangeX
import panel as pn
import panel.widgets as pnw
hv.extension('bokeh')
pn.extension()

#Generating random data
time_min = 30#minutes

fs = 180
num_samples = time_min*60*fs
index = np.arange(0,num_samples)
time = index/180 #seconds

#Generating data
sine = np.sin(time)
linear = time
square = np.square(time)

#Creating data frame
data = {"time":time,"sine":sine,"linear":linear,"square":square}
df = pd.DataFrame(data=data)
#Initializing variables


left_variable = pnw.Select(name = "variable select", options=["square","linear","sine"])

def plot(variable):
    return hv.Curve((df['time'].values, df[variable].values))#.opts(framewise = True)

#creating timeplot
@pn.depends(variable = left_variable.param.value)
def time_plot(variable):

    return plot(variable)

dmap = datashade(hv.DynamicMap(time_plot)).opts(width = 700)

#Creating dashboard
dashboard = pn.Column(left_variable,dmap)
error = False
try:
    display = dashboard.show(port=38501)
    display
except OSError as error:
    print("OS error")
    display.stop()
    display = dashboard.show(port=38501)
    display
I also tried changing the graphs to a class. The current functionality for the below code is that when zooming in and then switching variables the plot will stay zoomed which is good. The unfortunate issue though is that I cannot zoom out but hitting reset. I think this is happening because I need to trigger an event to redraw the graph. I used PlotReset stream but that unfortunately doesn’t work either
I’m not sure if it’s the behavior you are looking for but with a hook you can acchieve this:
I havent you used your last piece of code but the one before
import numpy as np
import pandas as pd
import sys

import holoviews as hv
from holoviews.operation.datashader import datashade
from holoviews.streams import RangeX
import panel as pn
import panel.widgets as pnw
from functools import partial
hv.extension('bokeh')
pn.extension()


#Generating random data
time_min = 30#minutes

fs = 180
num_samples = time_min*60*fs
index = np.arange(0,num_samples)
time = index/180 #seconds

#Generating data
sine = np.sin(time)
linear = time
square = np.square(time)

#Creating data frame
data = {"time":time,"sine":sine,"linear":linear,"square":square}
df = pd.DataFrame(data=data)
#Initializing variables


left_variable = pnw.Select(name = "variable select", options=["square","linear","sine"])

def plot(variable):
    return hv.Curve((df['time'].values, df[variable].values), vdims="W")

#creating timeplot
@pn.depends(variable = left_variable.param.value)
def time_plot(variable):
    return plot(variable)

def reset_y_hook(plot, elem):
    bkplot = plot.handles['plot']
    ydata = elem.dataset.data[elem.dataset.vdims[0].name]
    y_range = ydata.min(), ydata.max()
    old_y_range_reset = bkplot.y_range.reset_start, bkplot.y_range.reset_end
    if old_y_range_reset != y_range:
        bkplot.y_range.start, bkplot.y_range.end = y_range
        bkplot.y_range.reset_start, bkplot.y_range.reset_end = y_range

dmap = datashade(hv.DynamicMap(time_plot)).opts(width=700, hooks=[reset_y_hook])
#Creating dashboard
dashboard = pn.Column(left_variable,dmap)
dashboard